ggplot2
Posts featuring ggplot2.
Making headlines
Using the headliner package for data driven ggplot titles Continue reading Making headlines
Dual axis charts in ggplot2 - why they can be useful and how to make them
Create Pareto charts in ggplot2 with custom legends using manual scales and ggtext Continue reading Dual axis charts in ggplot2 - why they can be useful and how to make them

Introducing popthemes
Introducing another set of palettes and scales for ggplot2, based on pop album covers. Continue reading Introducing popthemes
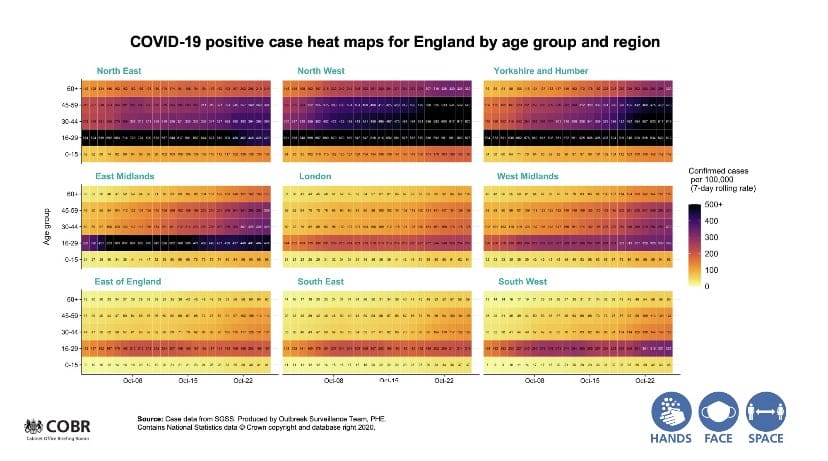
When dataviz meets 'reality'
The UK Government Coronavirus briefing on Saturday caused all sorts of consternation. Not least, the graphics that were presented in support of further lockdown. What happened, how bad was it really, and what could be improved? Continue reading When dataviz meets 'reality'
SIMD Revisited
Visualising the 2020 Scottish Index of Multiple Deprivation data. Continue reading SIMD Revisited
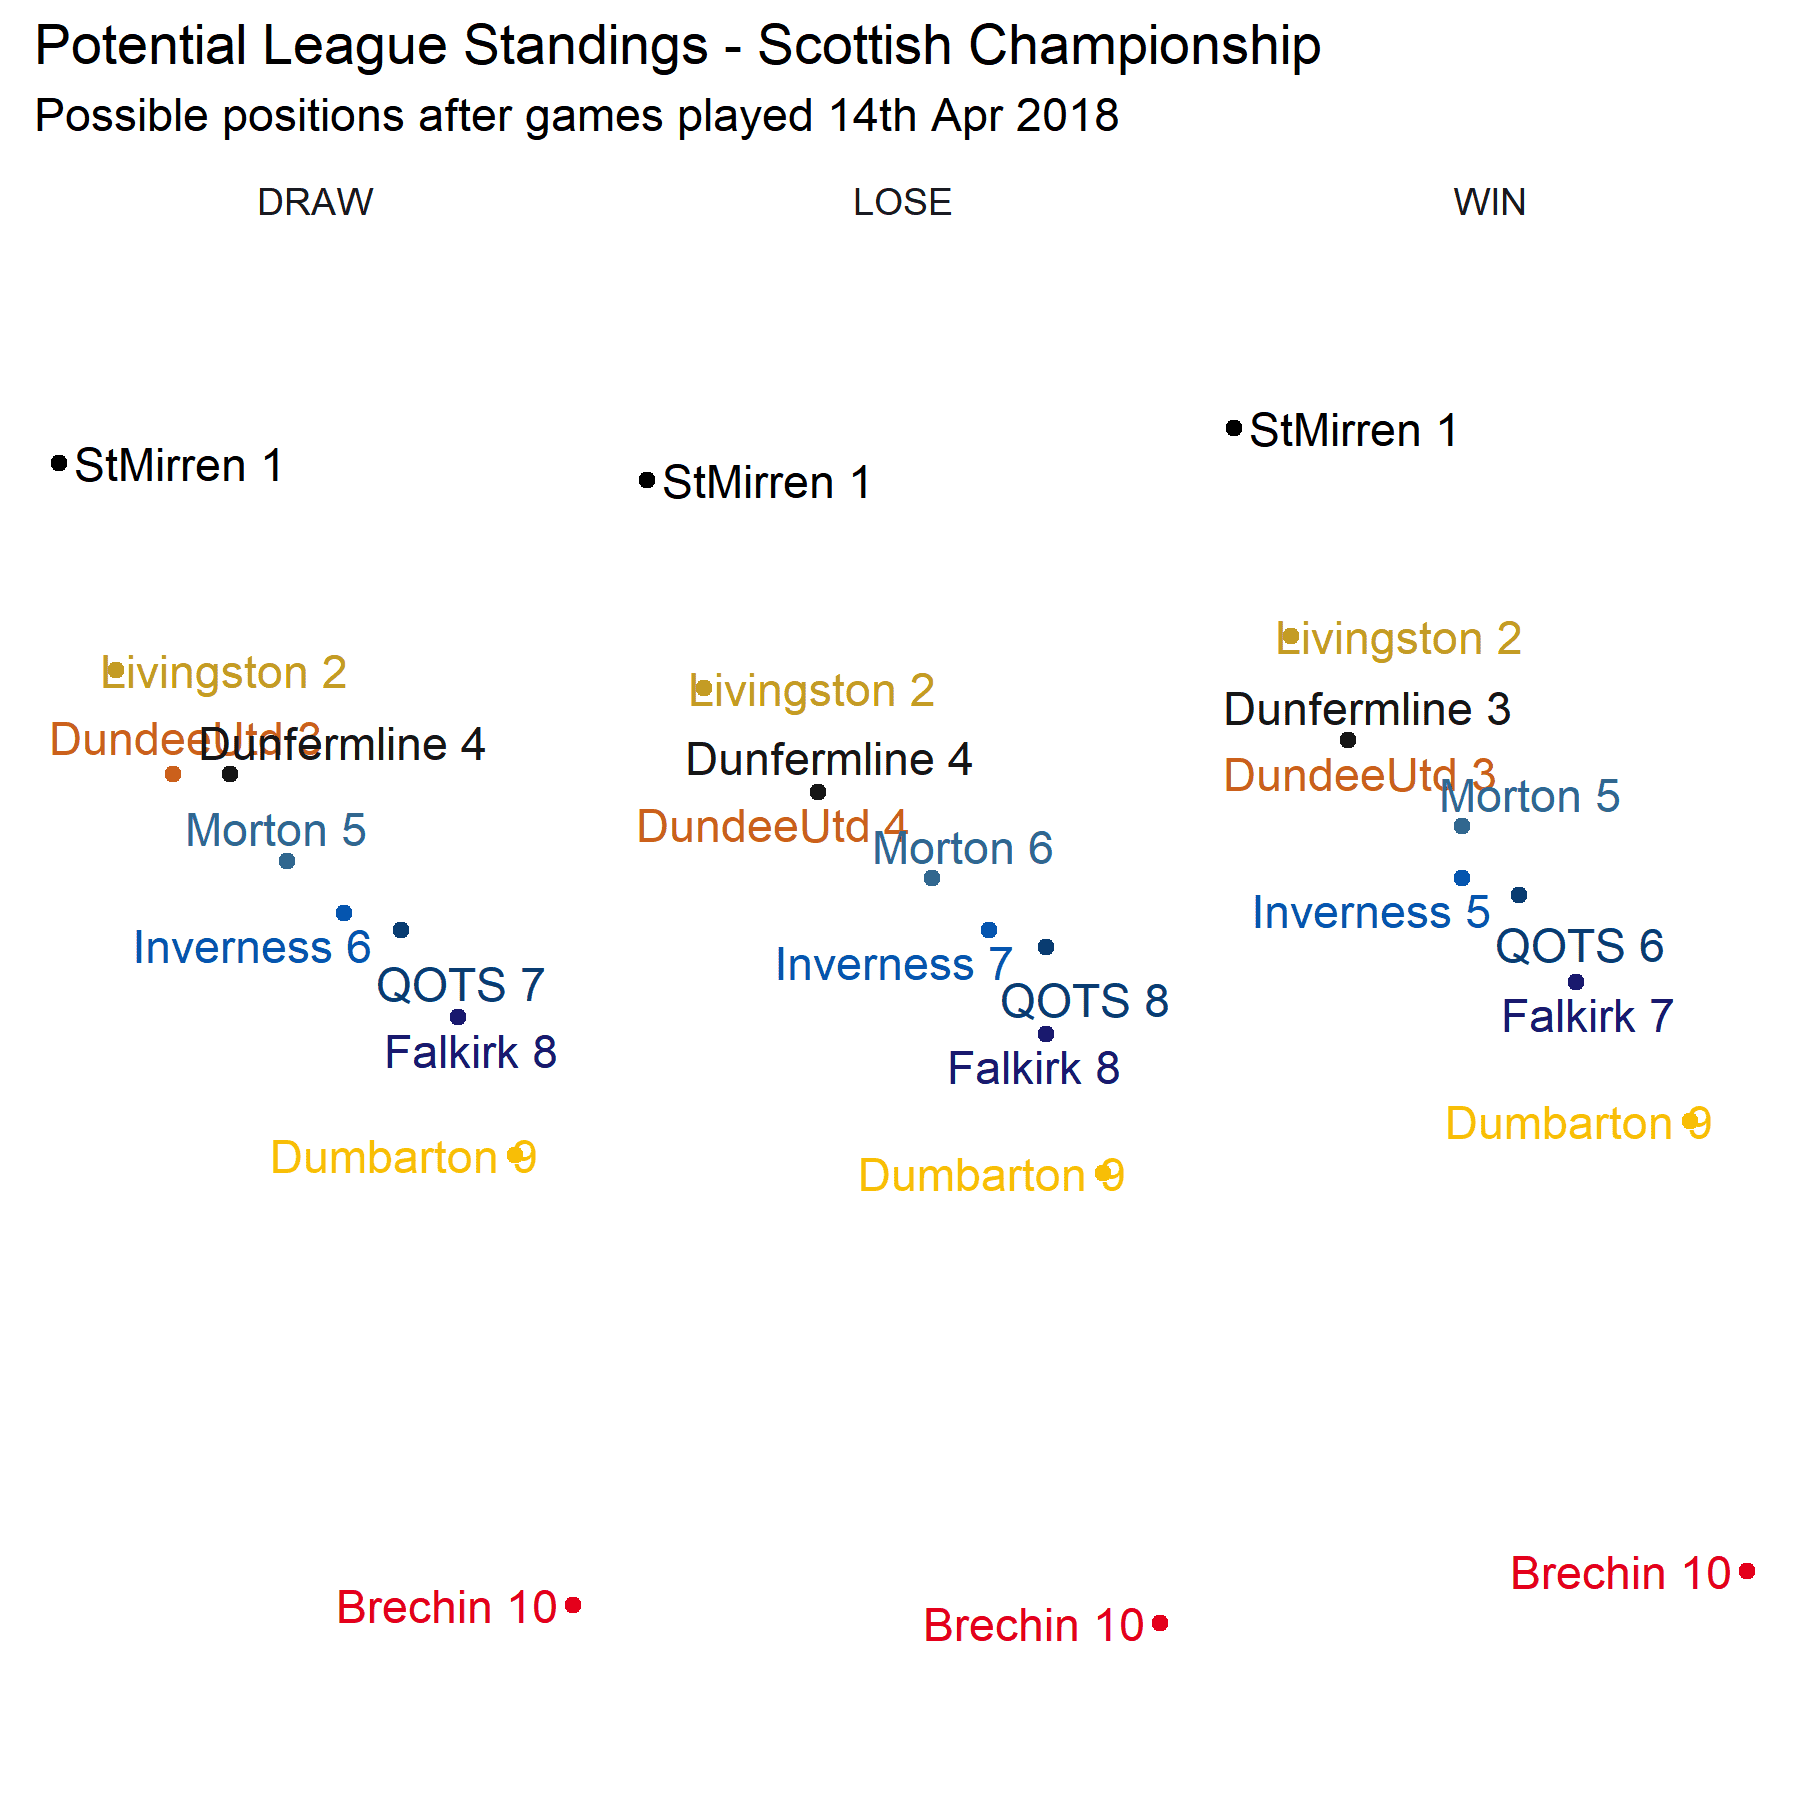
Mid Table Mediocrity
Visualising potential winners and promotion prospects in the Scottish Championship Continue reading Mid Table Mediocrity
More tidy evaluation with ggplot2
Another look at tidy evaluation with a slight twist on the previous post Continue reading More tidy evaluation with ggplot2
Tidily evaluated ggplot2
Test driving tidy evaluation in the new release of ggplot2 Continue reading Tidily evaluated ggplot2

AphA Scotland - it's a thing now
Reflections on AphA Scotland launch event Continue reading AphA Scotland - it's a thing now
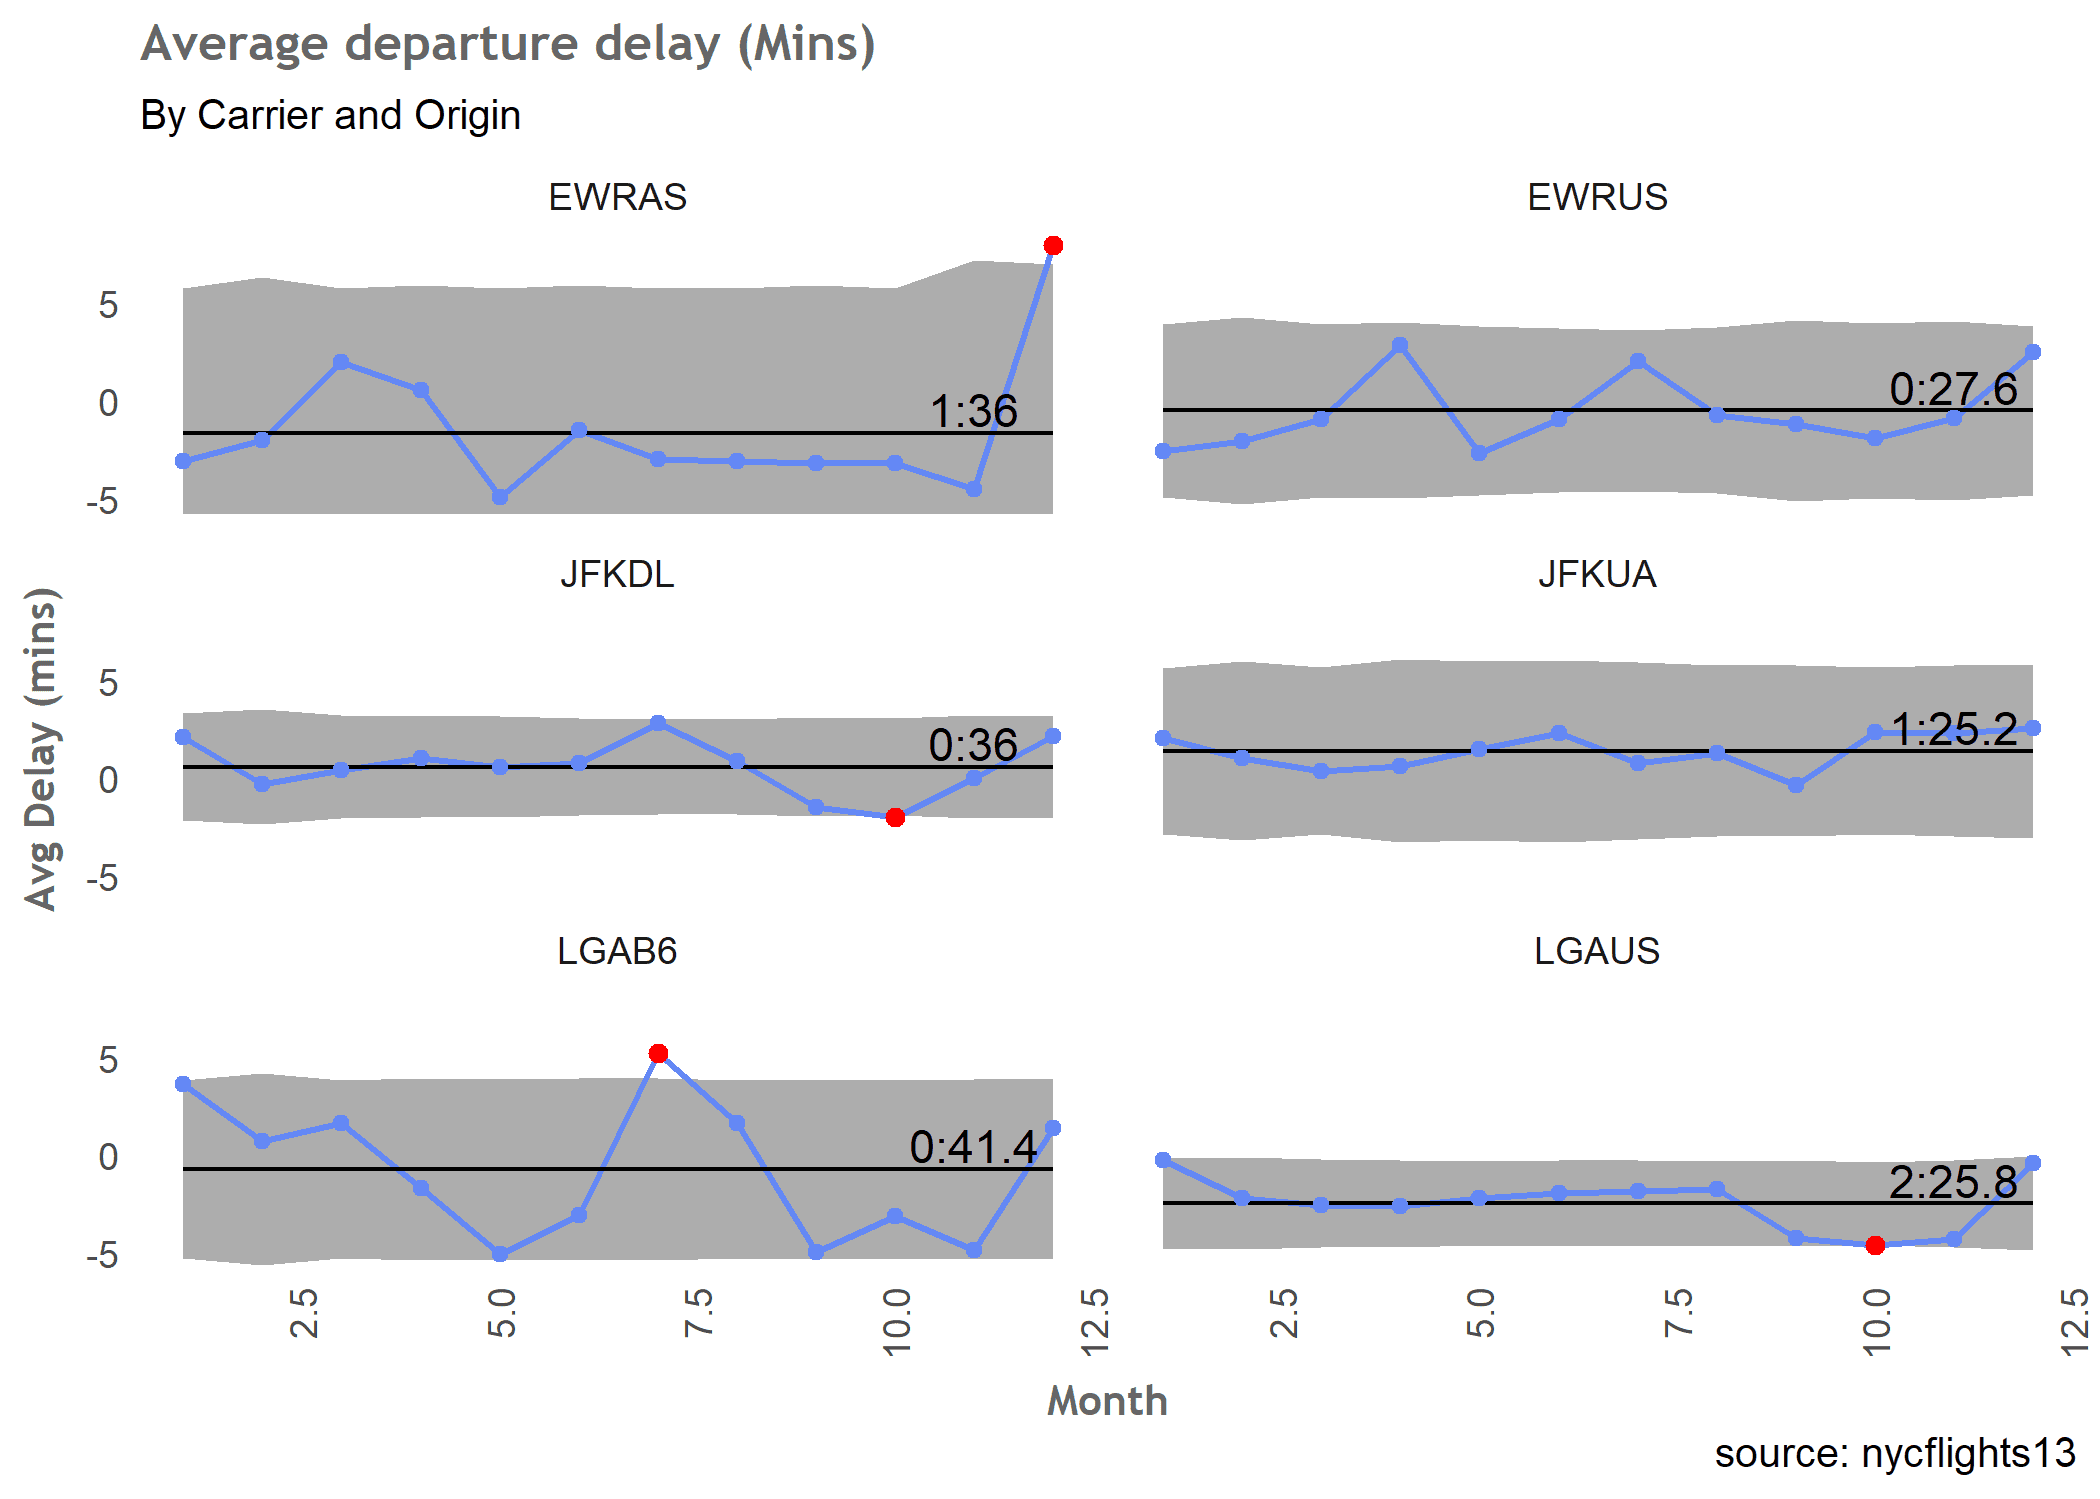
Backed by Data
Minimising the risk of delayed departure with process control charts Continue reading Backed by Data
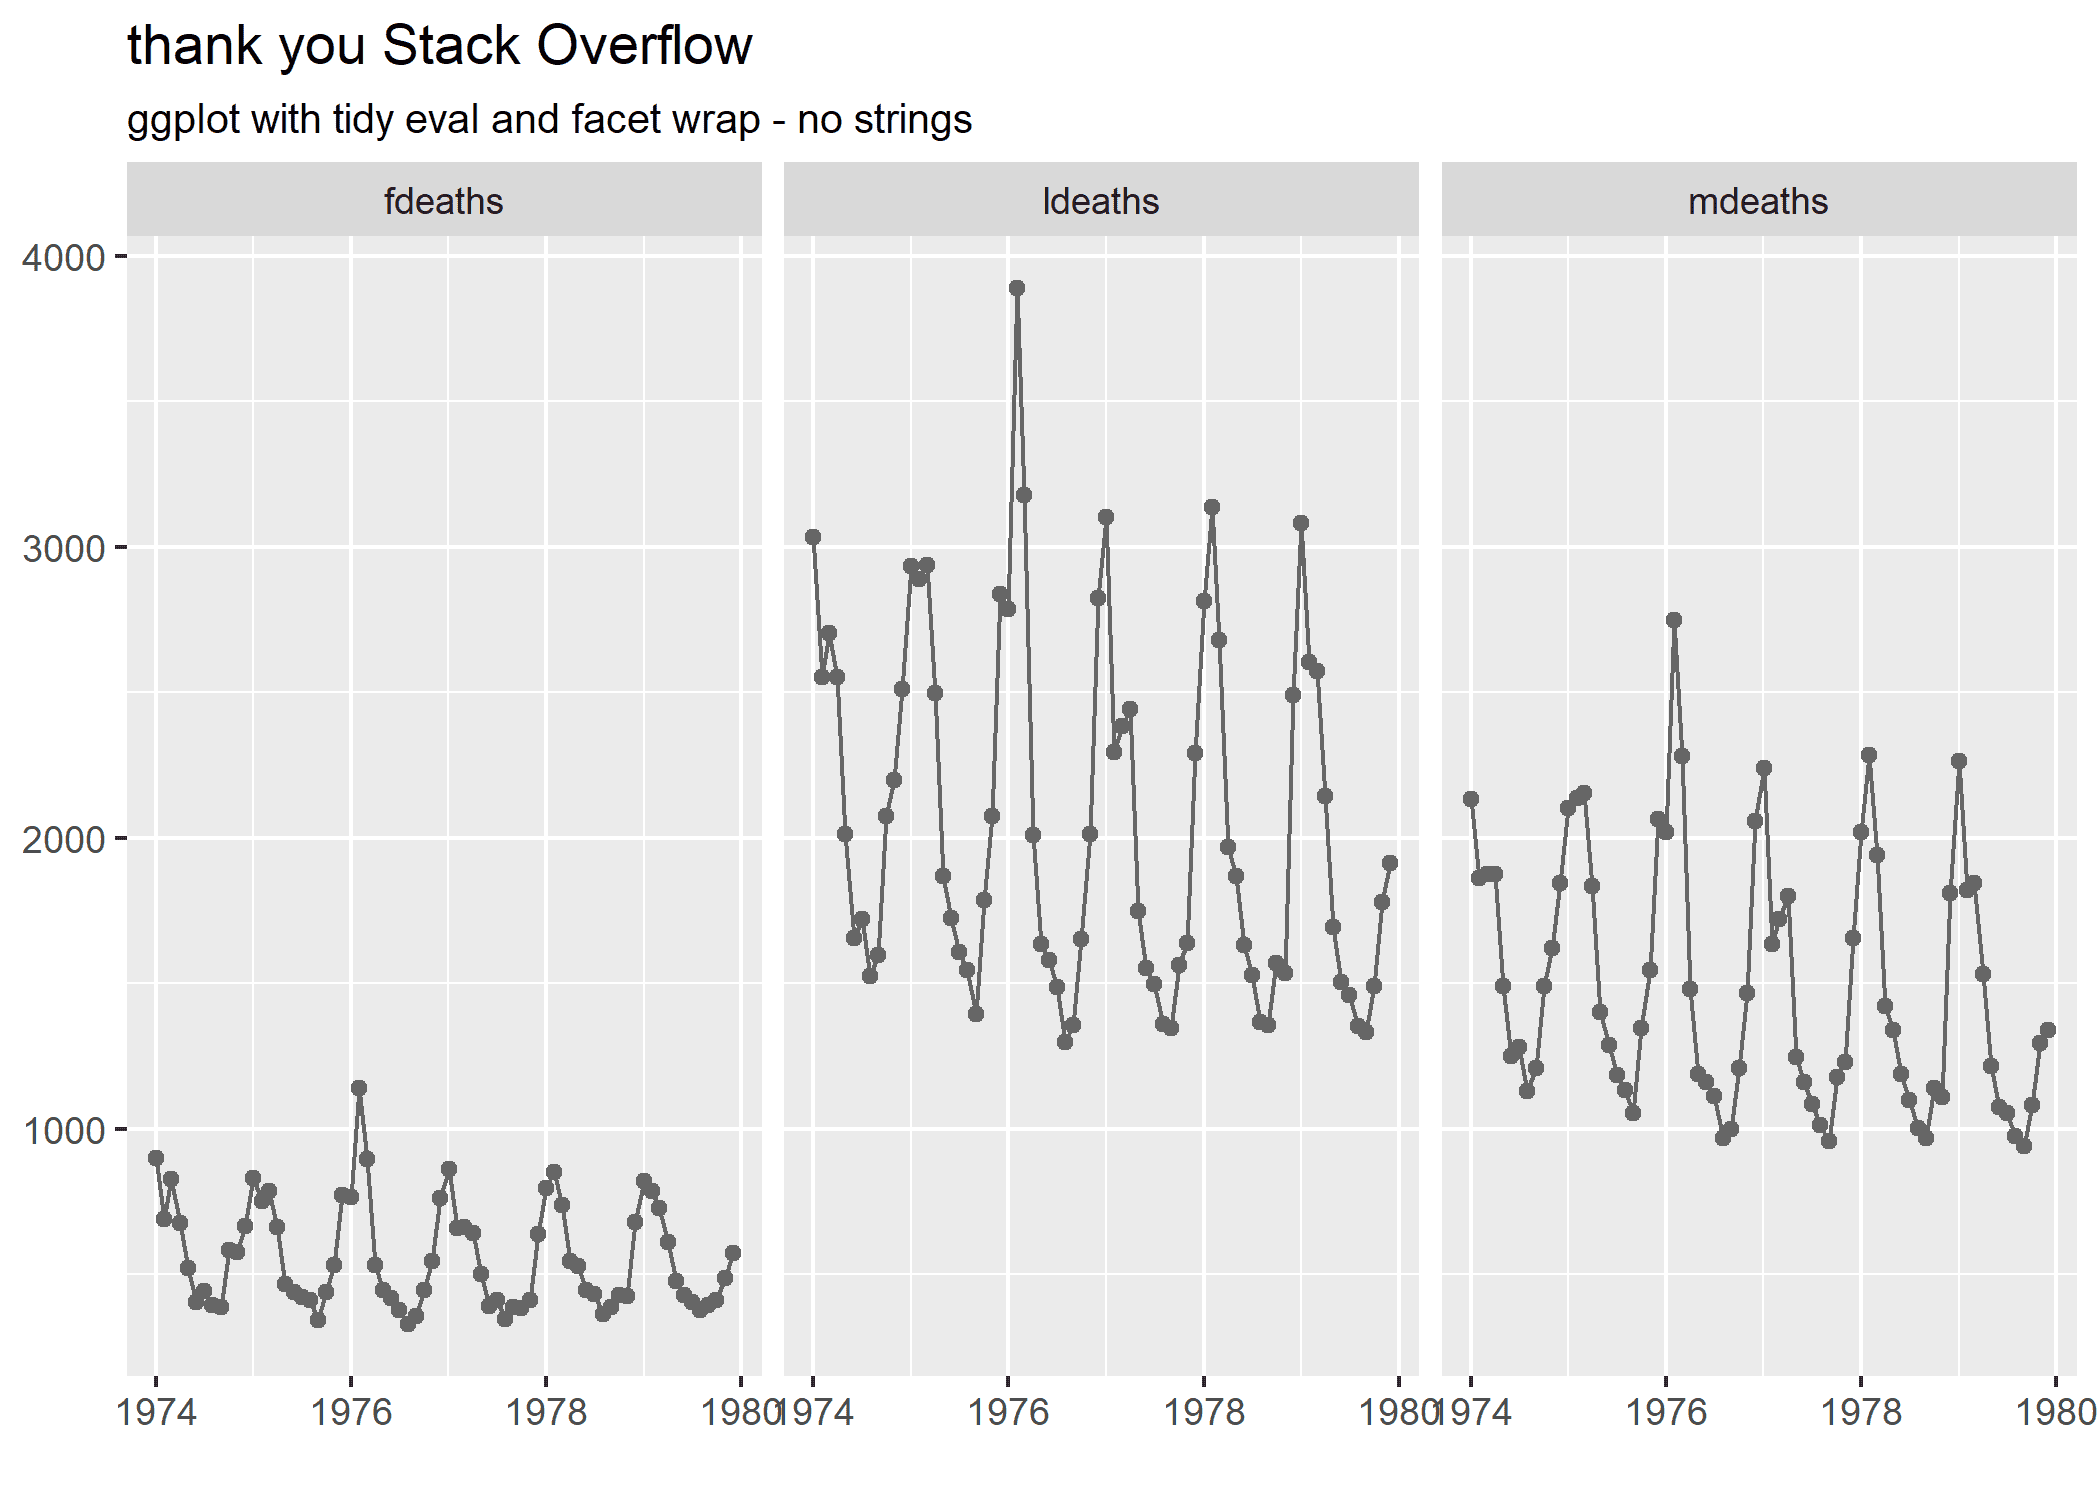
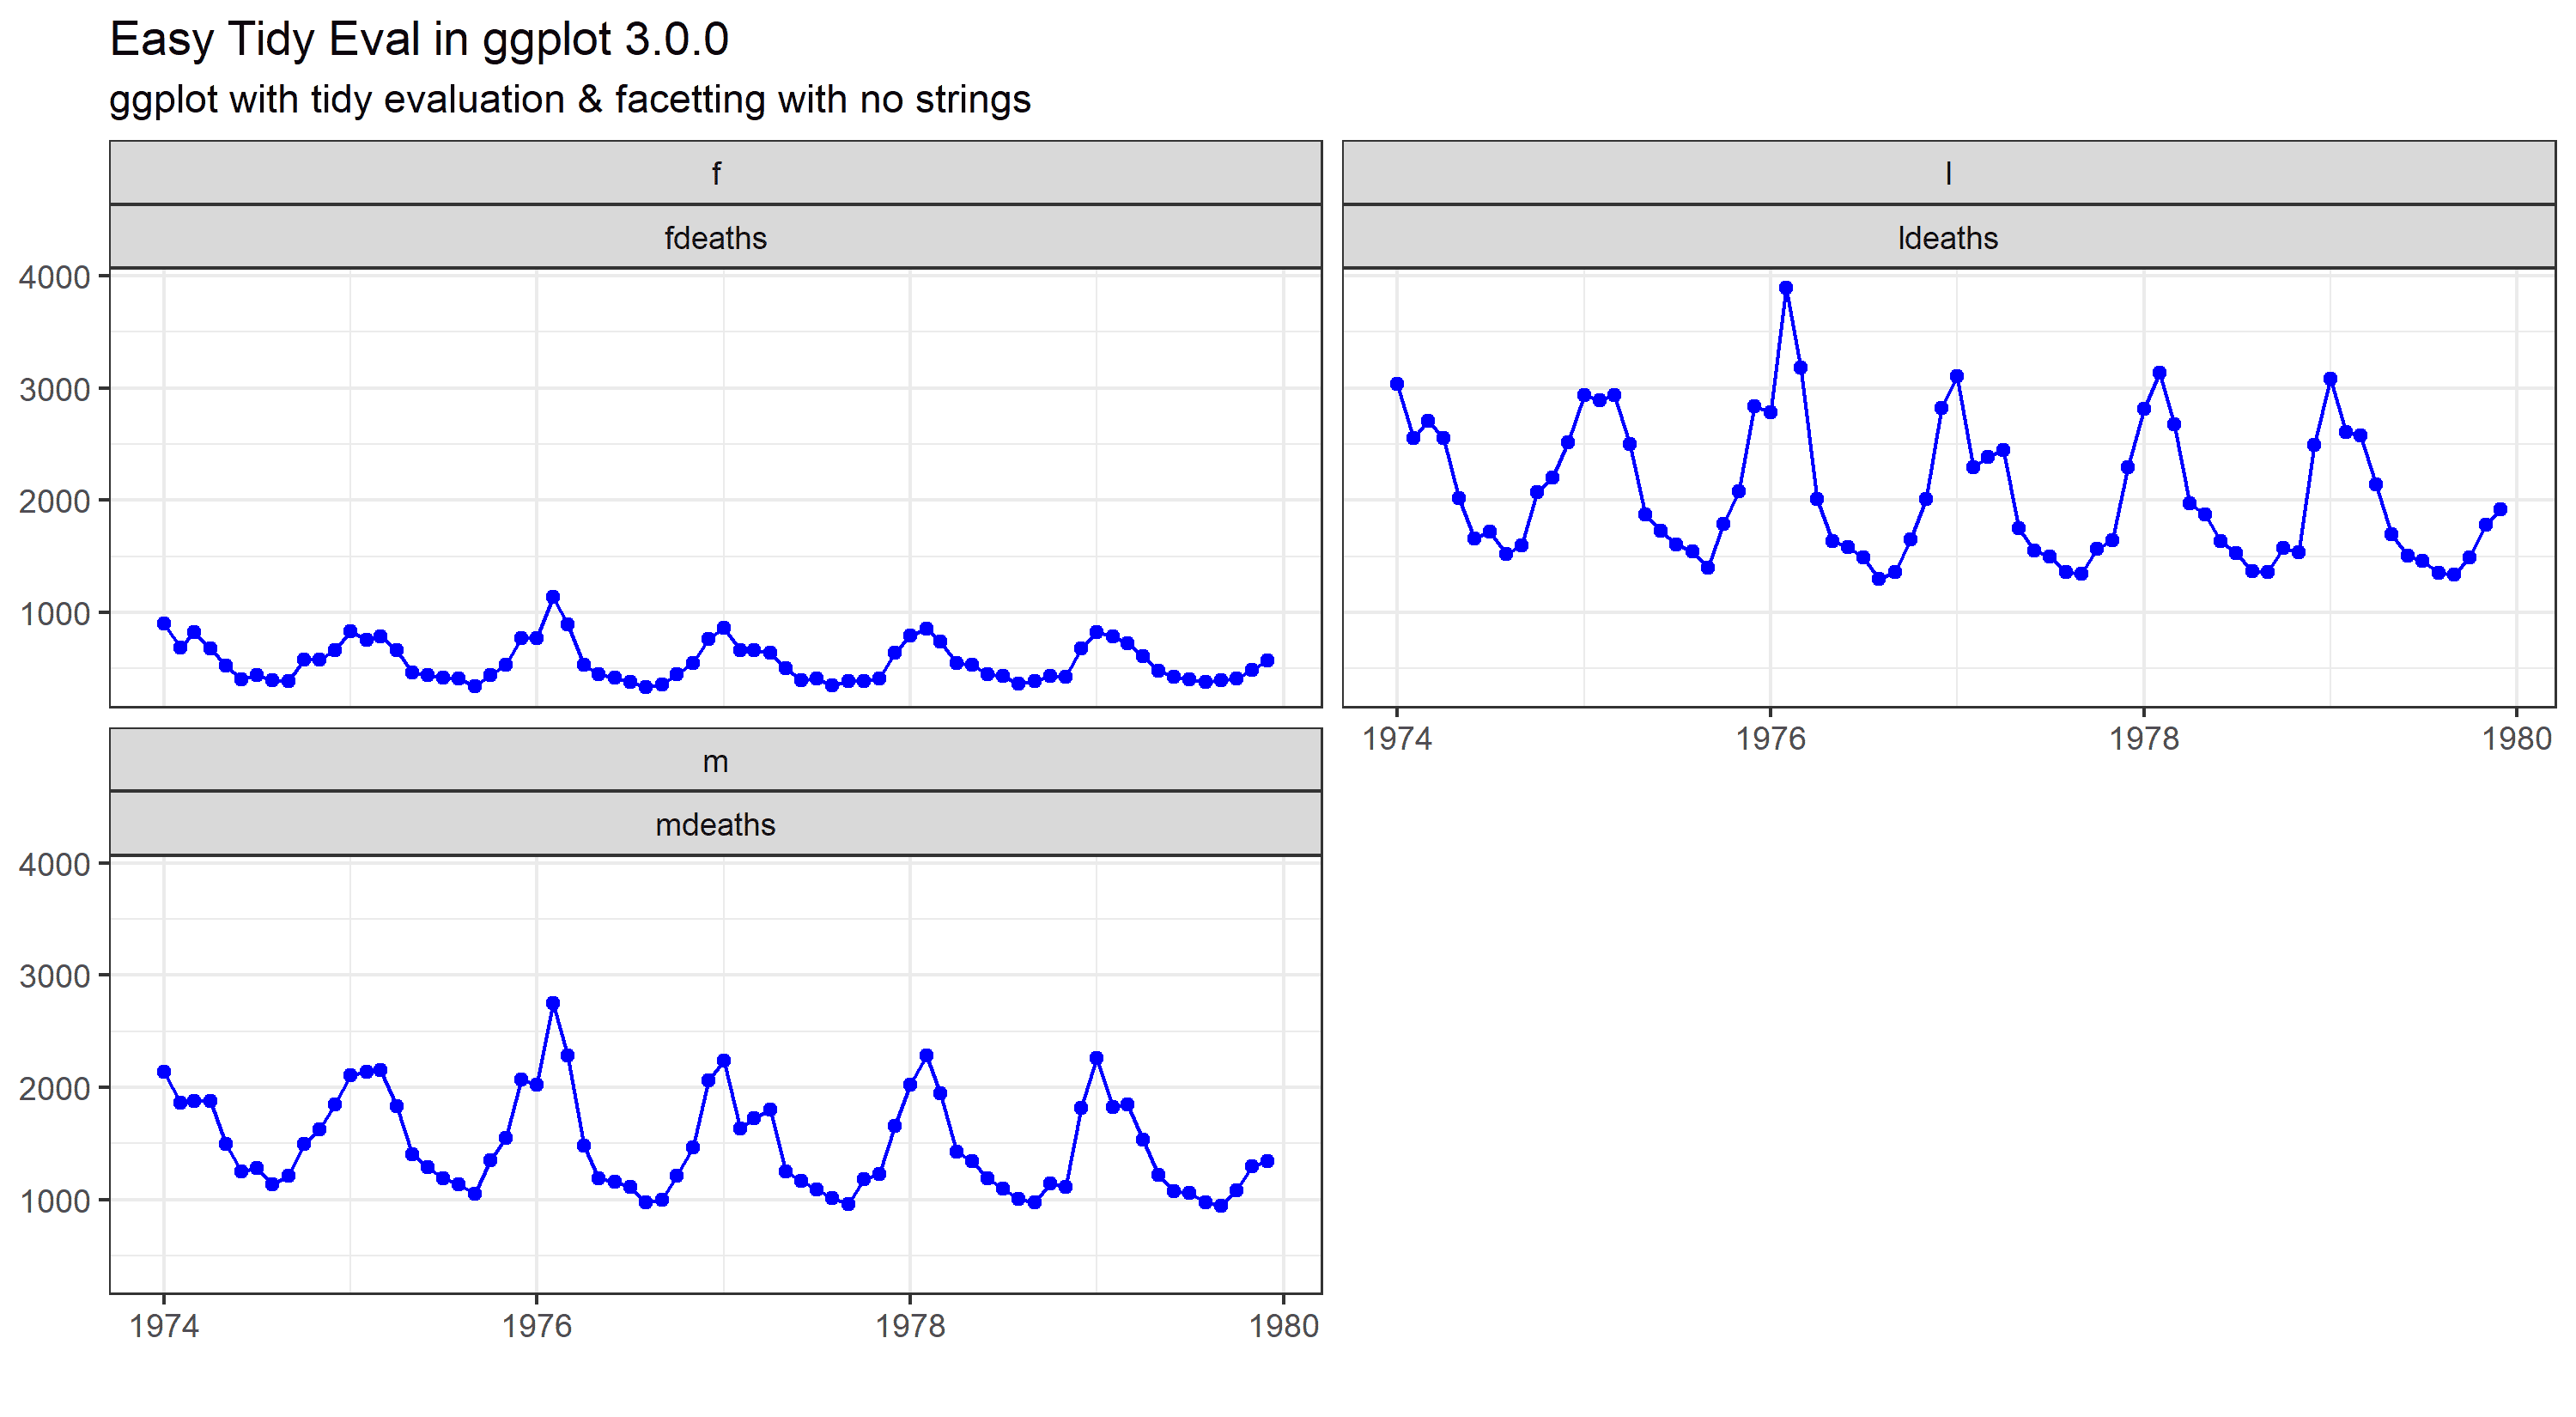
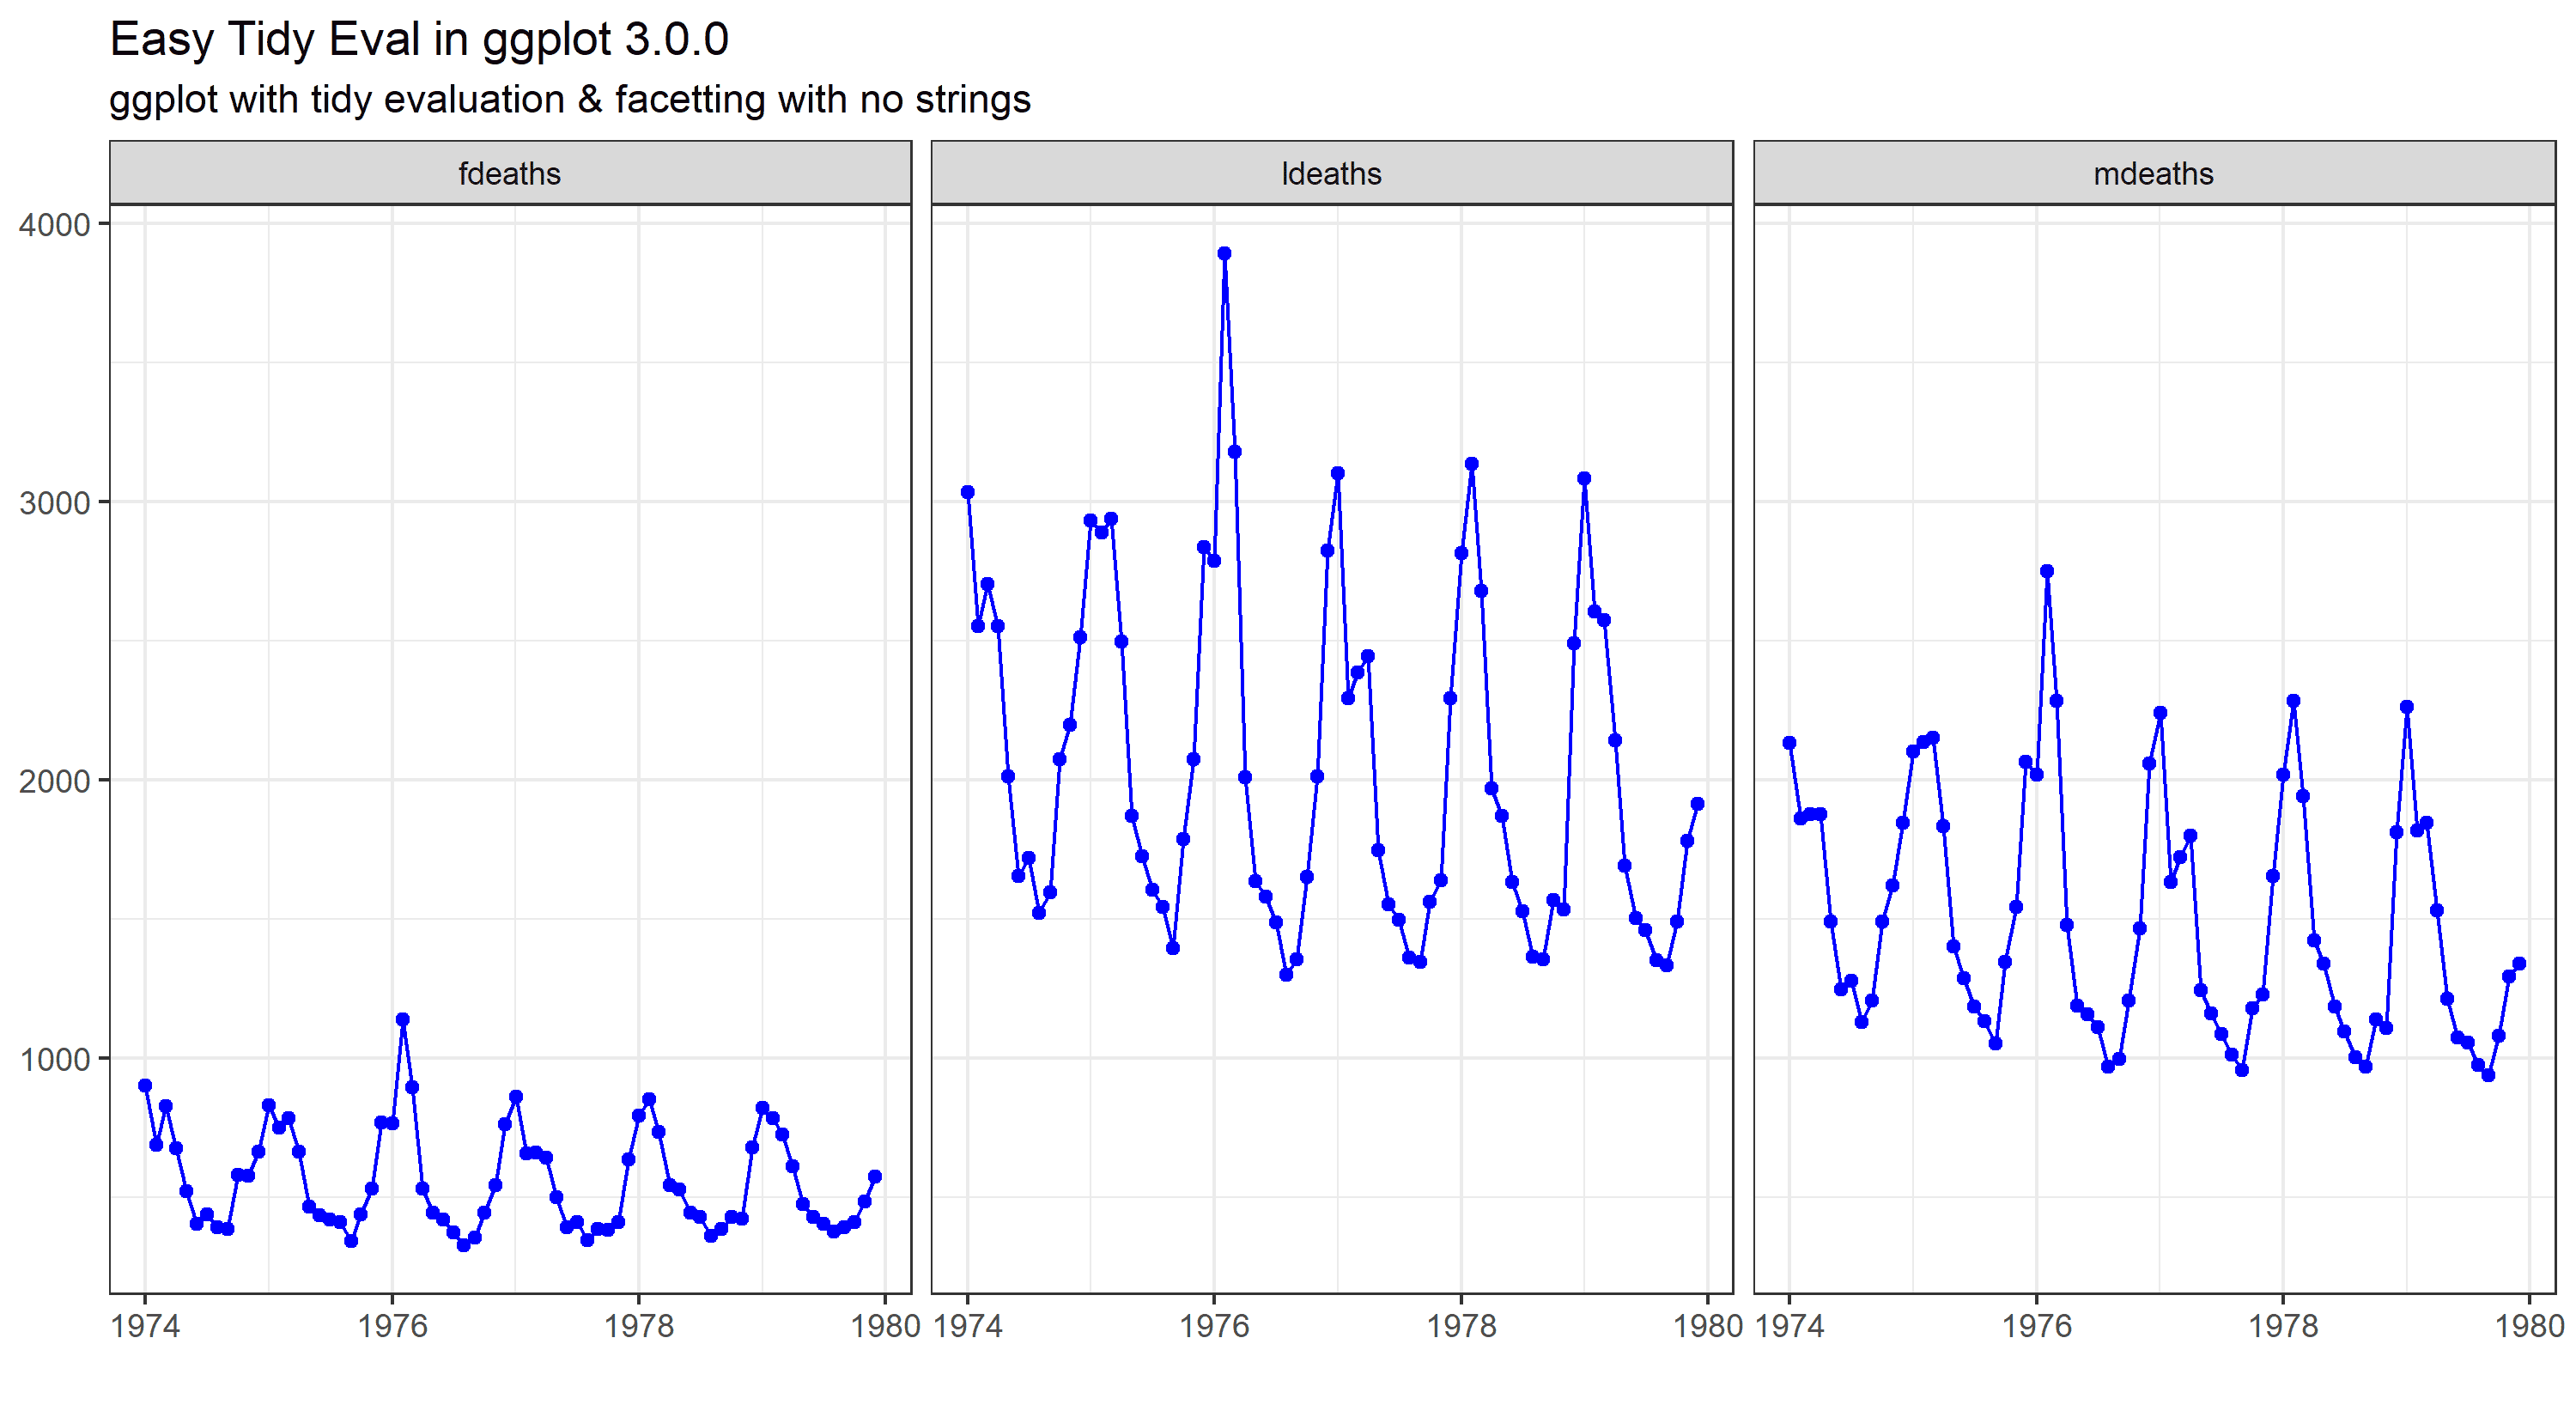
No strings attached
creating a faceting function with bare variable names in ggplot2, base R and rlang Continue reading No strings attached
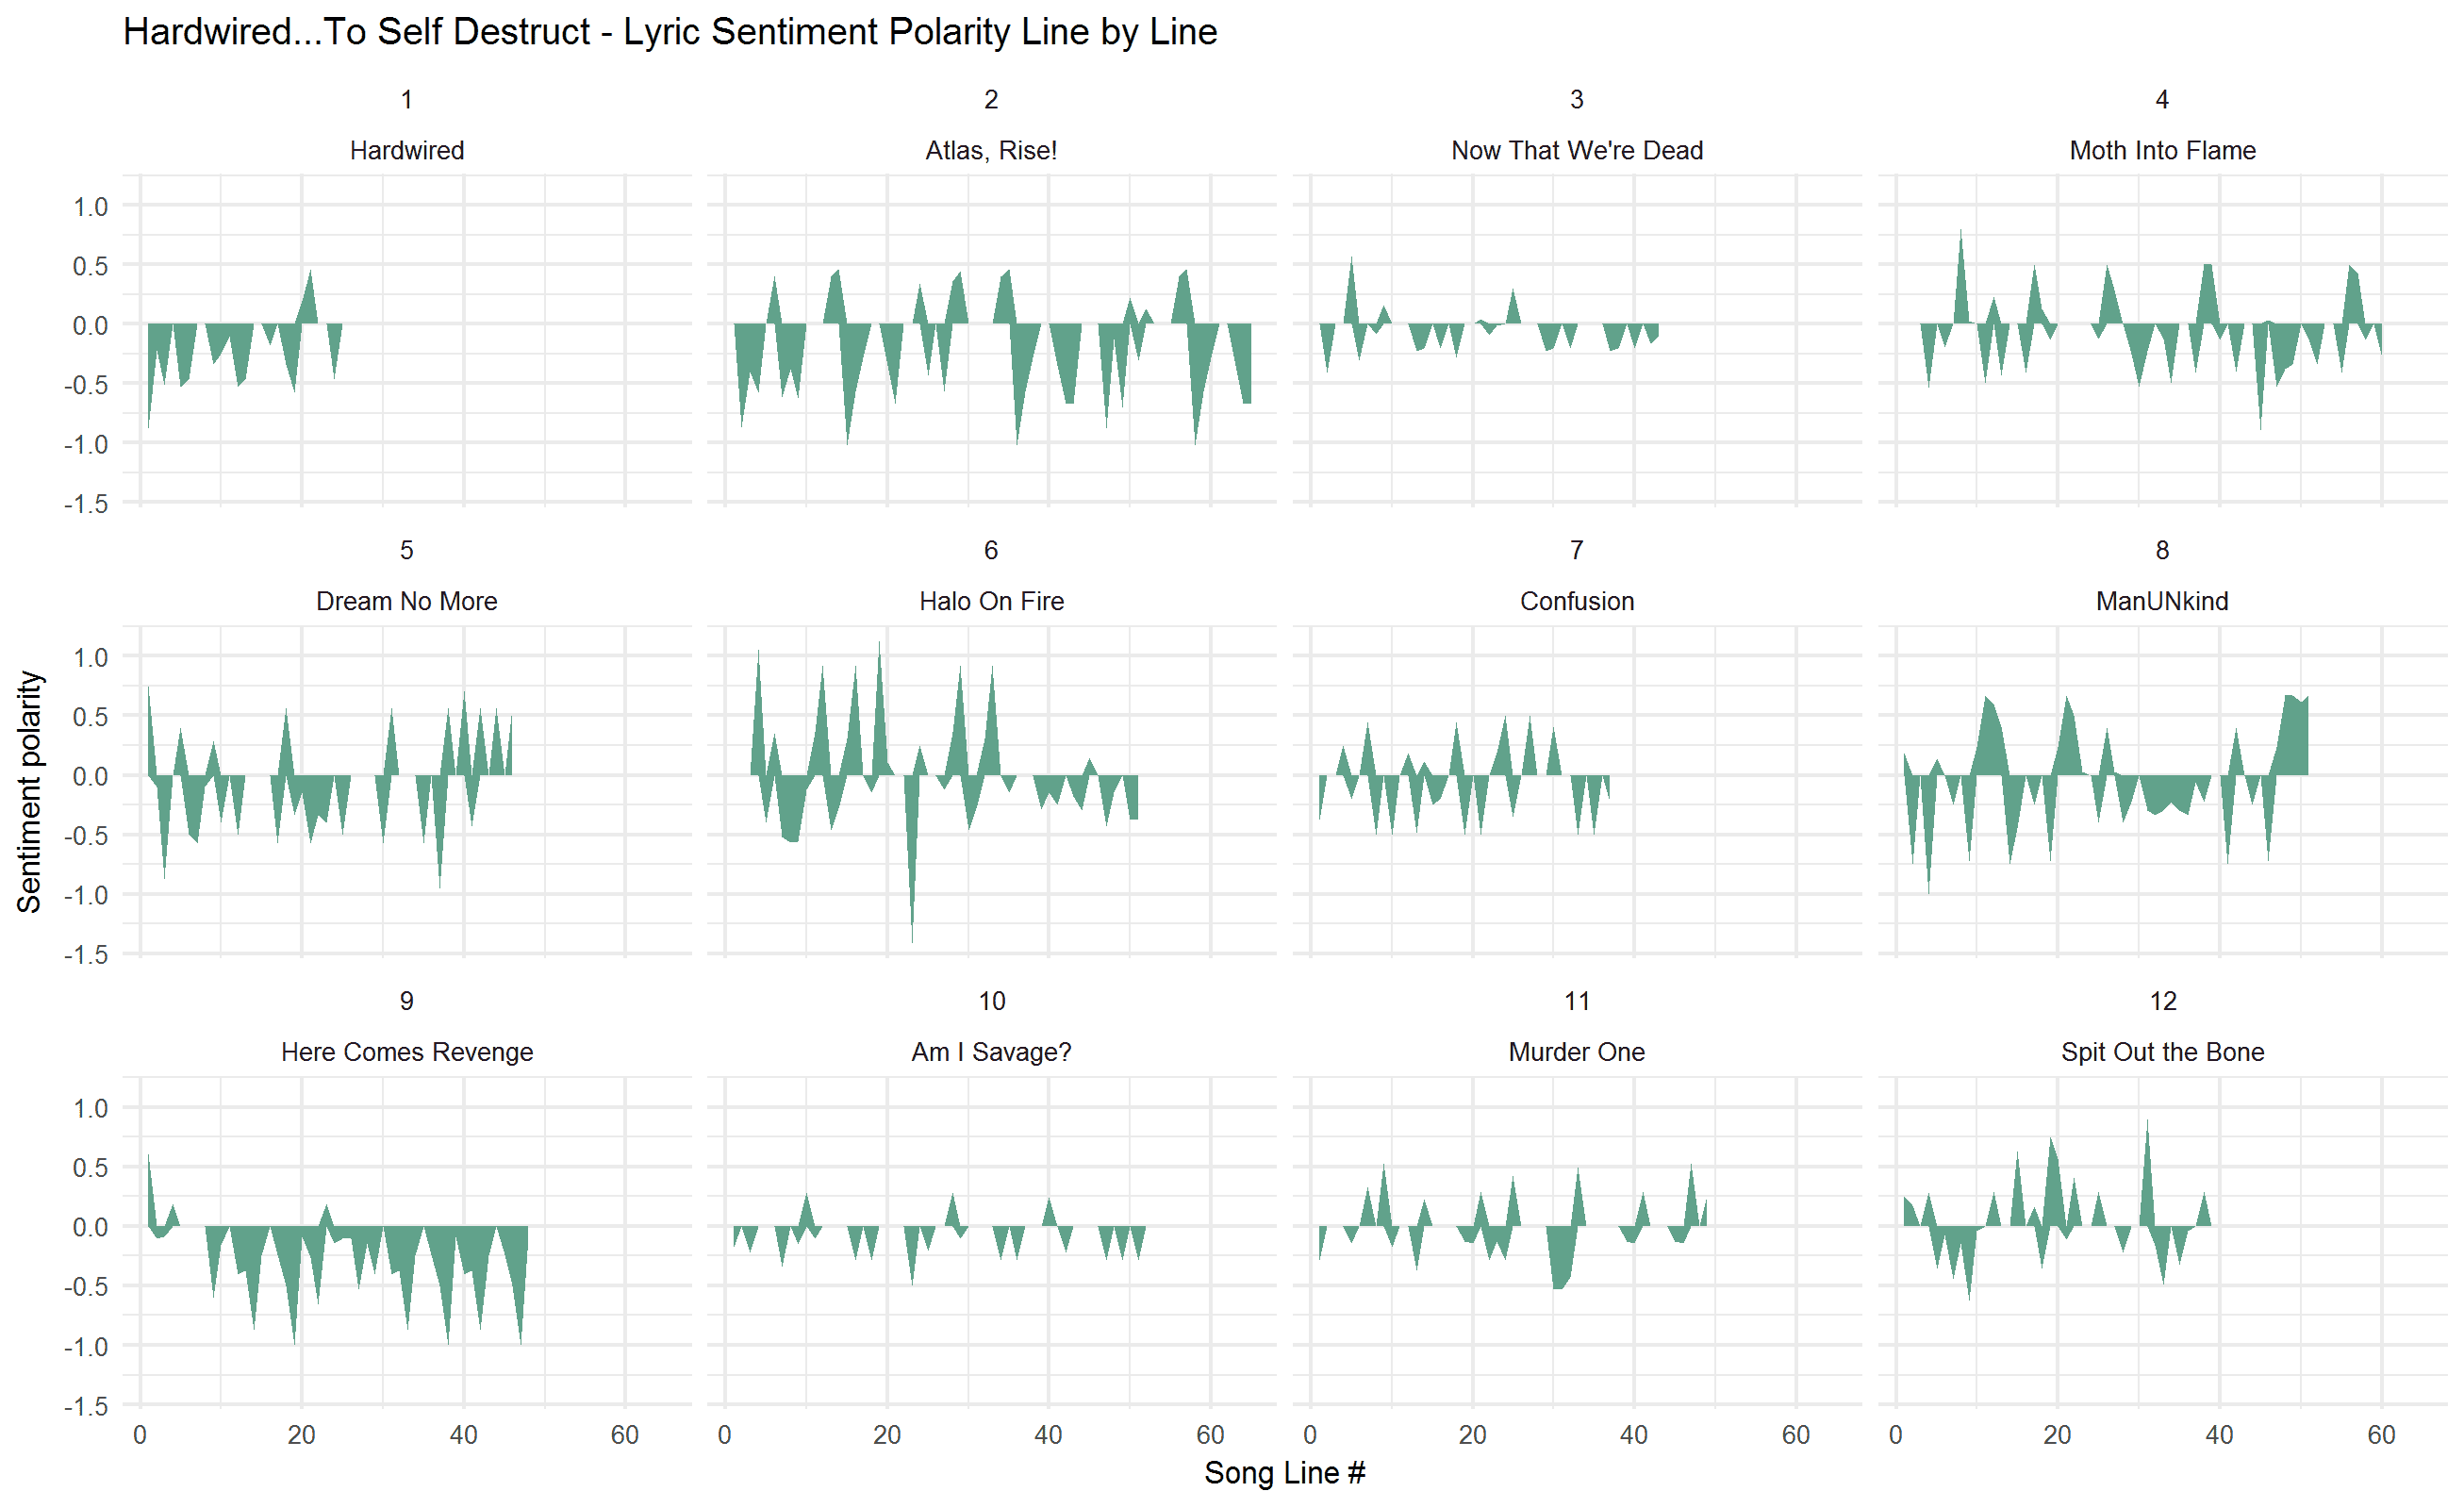
Enter Sa(n)dMan
More Metallica sentiment analysis Continue reading Enter Sa(n)dMan

Hardwired..for tidy text
sentiment and text analysis of Metallica lyrics with genius and tidytext Continue reading Hardwired..for tidy text

It's a dirty job, but someone's got to do it..
A tidytext analysis of Faith No More lyrics Continue reading It's a dirty job, but someone's got to do it..
Simply Mapping
Using the simple features package (sf) to map Scottish Index of Multiple Deprivation (SIMD) 2016 data Continue reading Simply Mapping
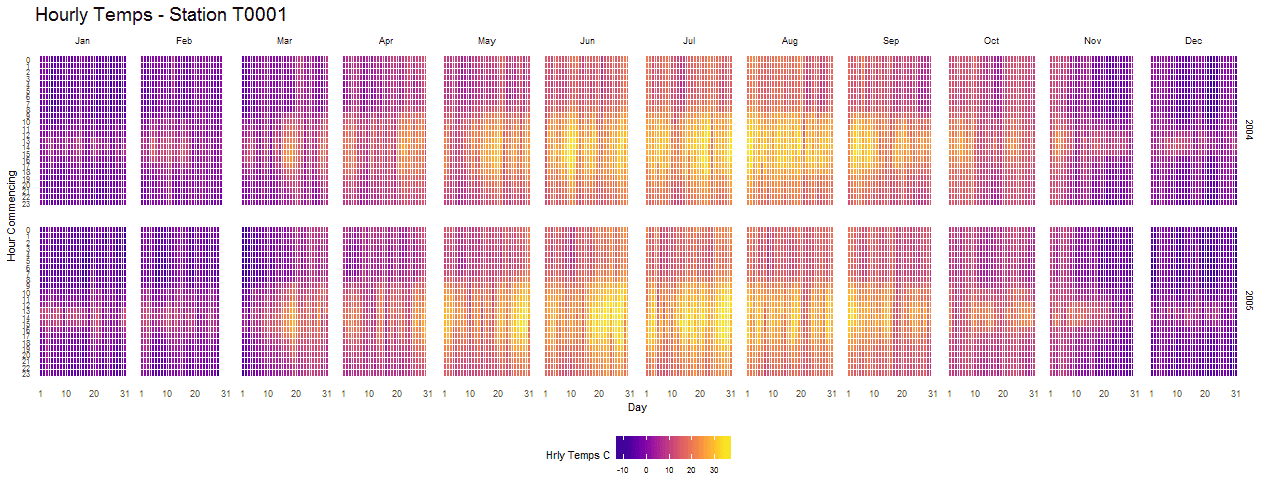
The hourly heatmap with ggplot2
A 24/7 timeseries heatmap with ggplot2, dplyr and lubridate Continue reading The hourly heatmap with ggplot2
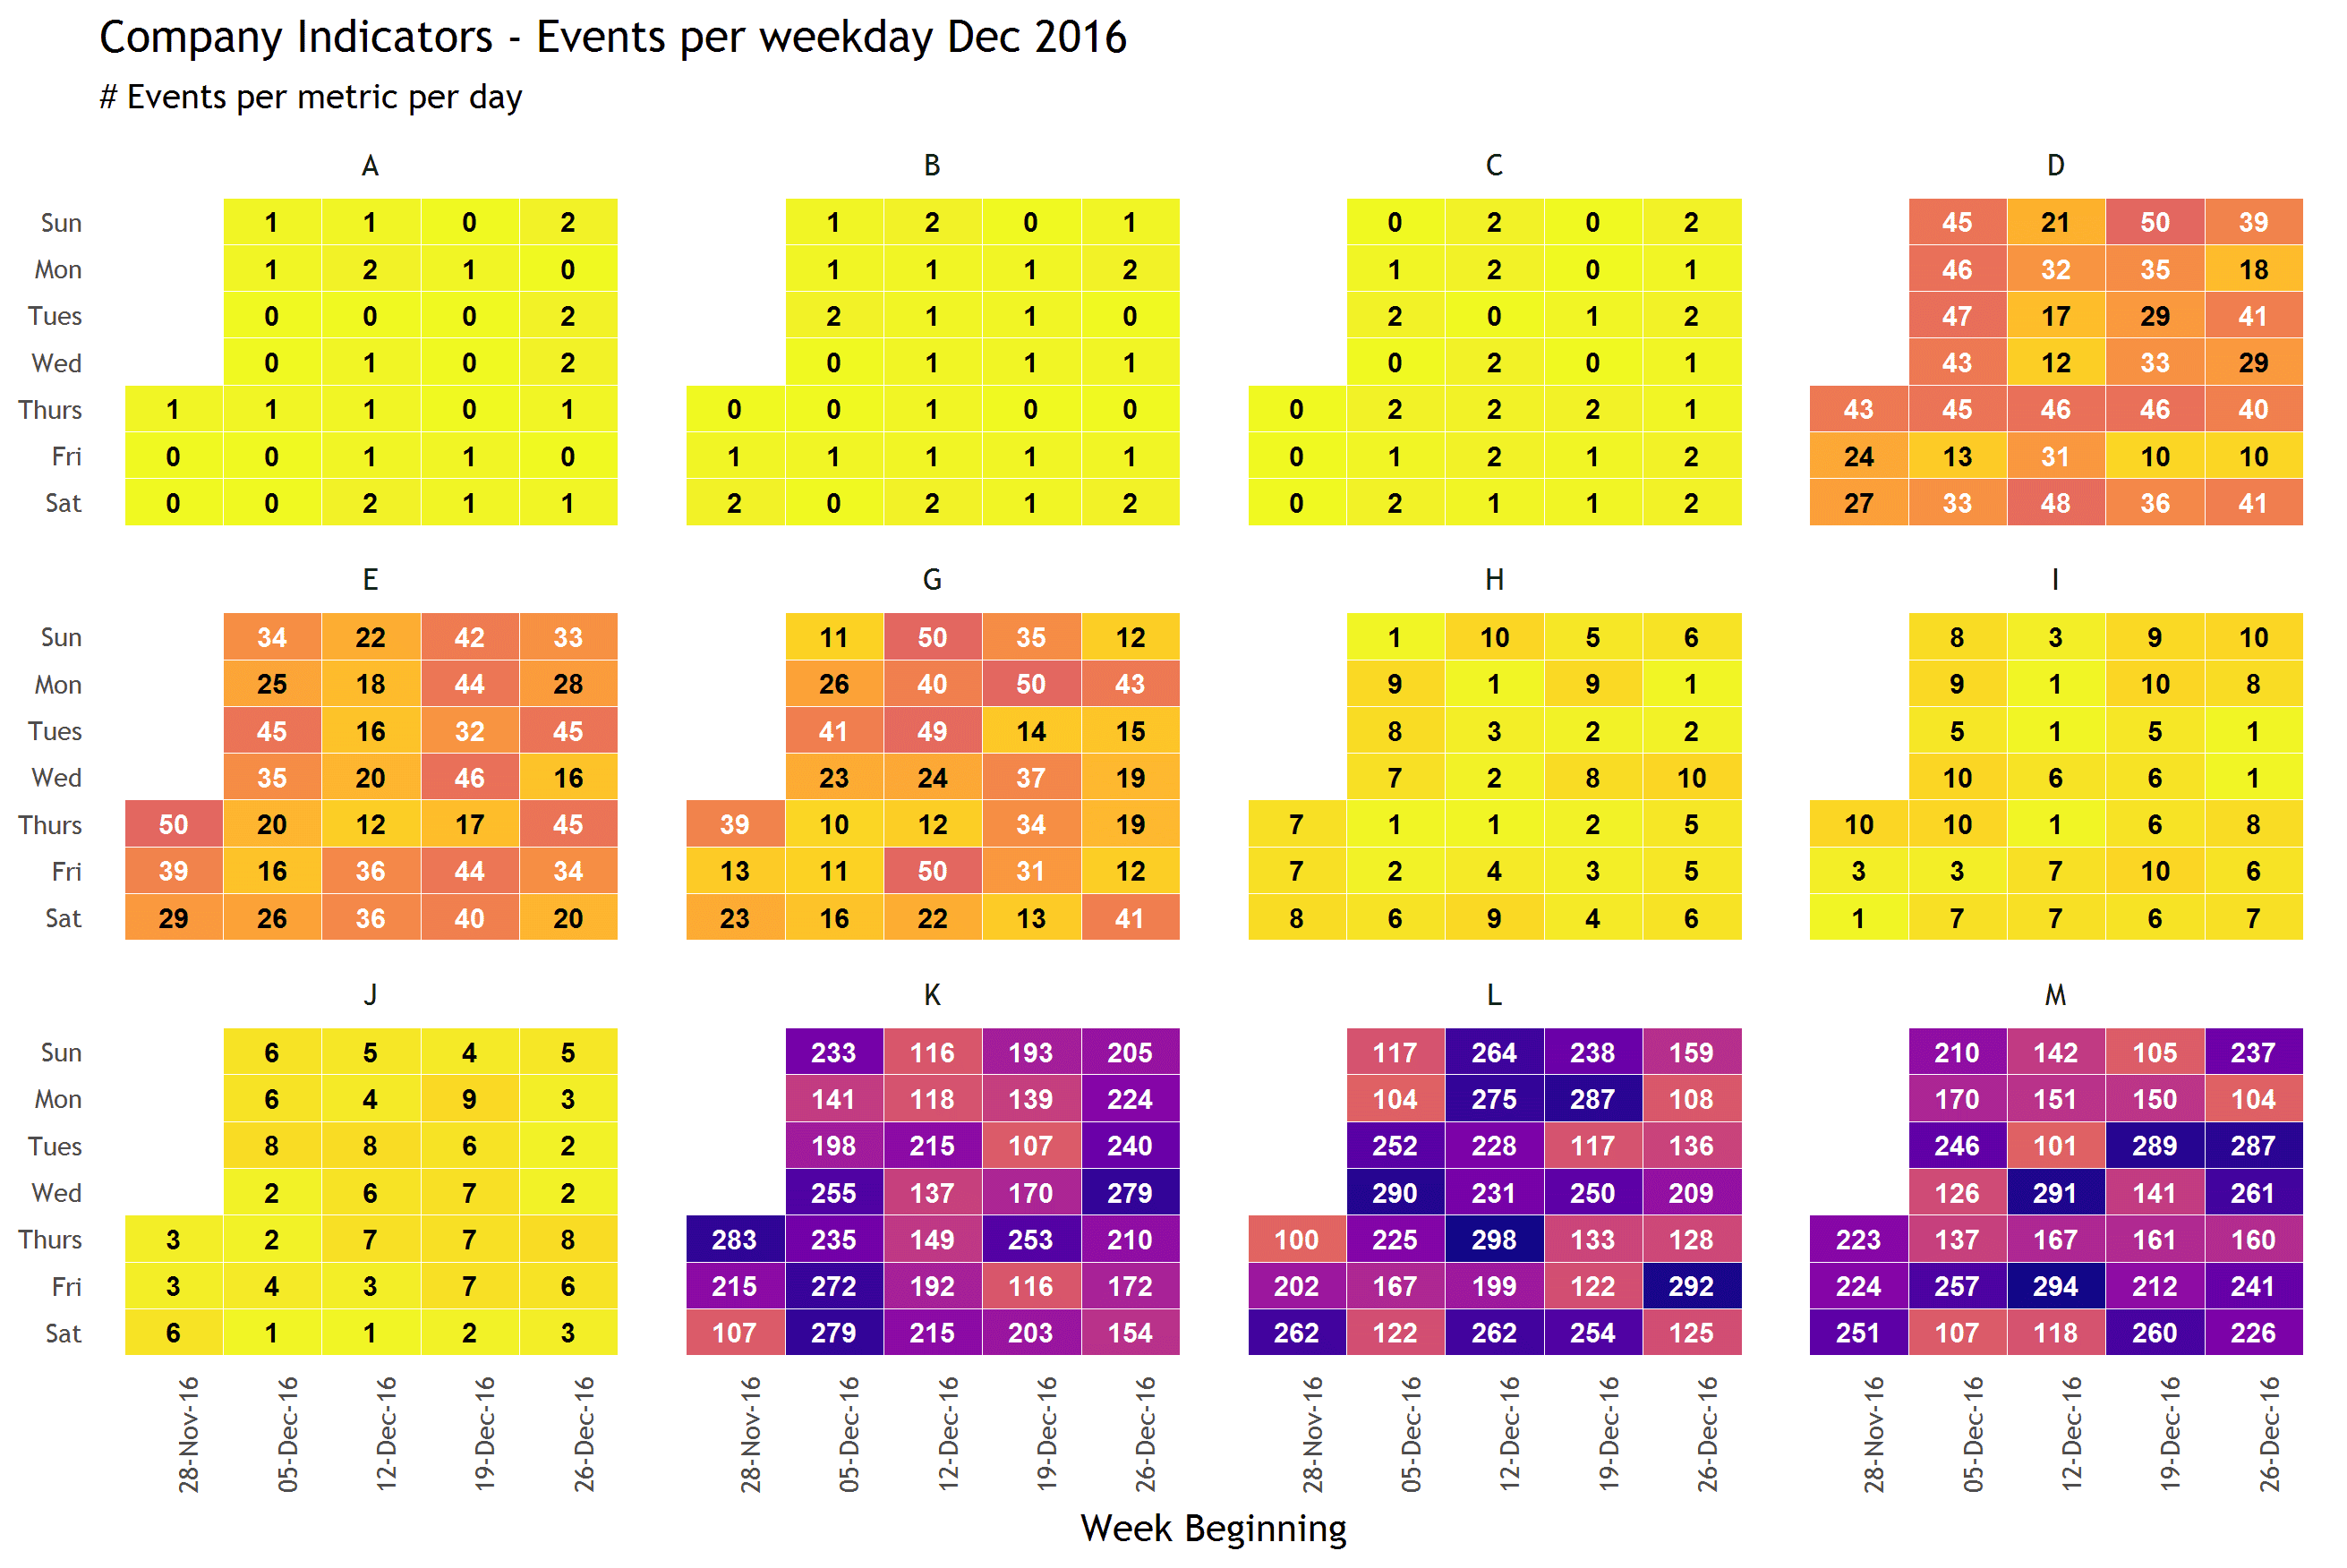
Daily metric tracking with ggplot2
Create calendar style plots over the same period with ggplot2 Continue reading Daily metric tracking with ggplot2
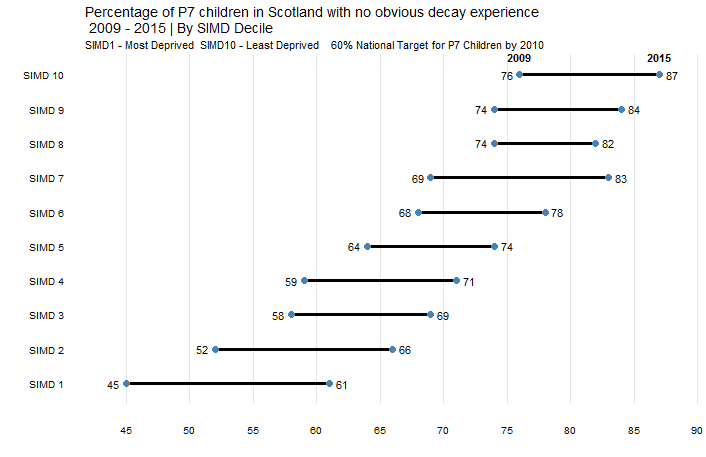
Chart MakeoveR
Working out and restyling a chart with (geom) dumbbells Continue reading Chart MakeoveR
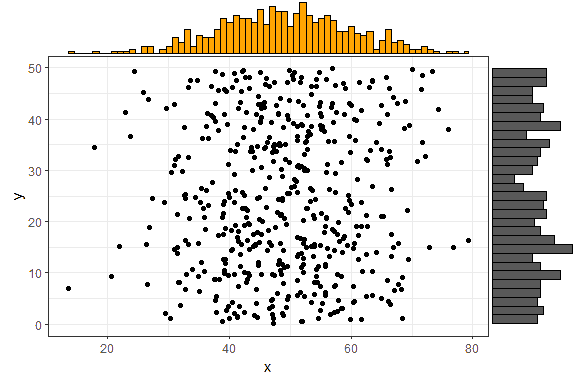
ggExtra is Extra useful
Amending scales on ggplots with easy to remember syntax Continue reading ggExtra is Extra useful