rbloggers
Posts for rbloggers feed.
Moving back home
I’ve gone back to my old website domain Continue reading Moving back home
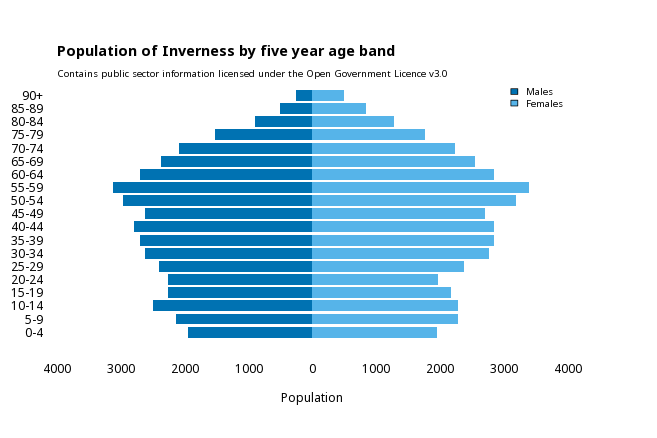
Population pyramid plots with base R
Population pyramids in the browser with shiny, and nothing else Continue reading Population pyramid plots with base R

new programming with data.table
baby steps creating handy functions with the new data.table programming interface Continue reading new programming with data.table
more .I in data.table
using .I and .N to retrieve the correct combination of records from grouped data Continue reading more .I in data.table
.I in data.table
A quick note to understand what .I does in data.table Continue reading .I in data.table
non-equi joins in data.table
A quick note to understand (non-equi) joins in data.table Continue reading non-equi joins in data.table
Making headlines
Using the headliner package for data driven ggplot titles Continue reading Making headlines

On target
A beginners introduction to getting started with the targets package in R Continue reading On target

Word Up - automatic reporting with MS Word, Officedown and flextable
Recreating existing Word reports in RMarkdown with Officer, Officedown and flextable. Continue reading Word Up - automatic reporting with MS Word, Officedown and flextable
modifying columns in datatable with lapply
How to modify or update multiple columns in rdatatable with lapply and SDcols Continue reading modifying columns in datatable with lapply

Exploring your database with shiny
Programatically querying a database with flexible SQL queries and visualising the results with shiny. Continue reading Exploring your database with shiny

Iterating over multiple database tables with the tidyverse
Extracting data from multiple database tables with dplyr and purrr. Continue reading Iterating over multiple database tables with the tidyverse

Dynamic SQL queries with R
Programmatic querying with dynamic schema, table and column names. Continue reading Dynamic SQL queries with R
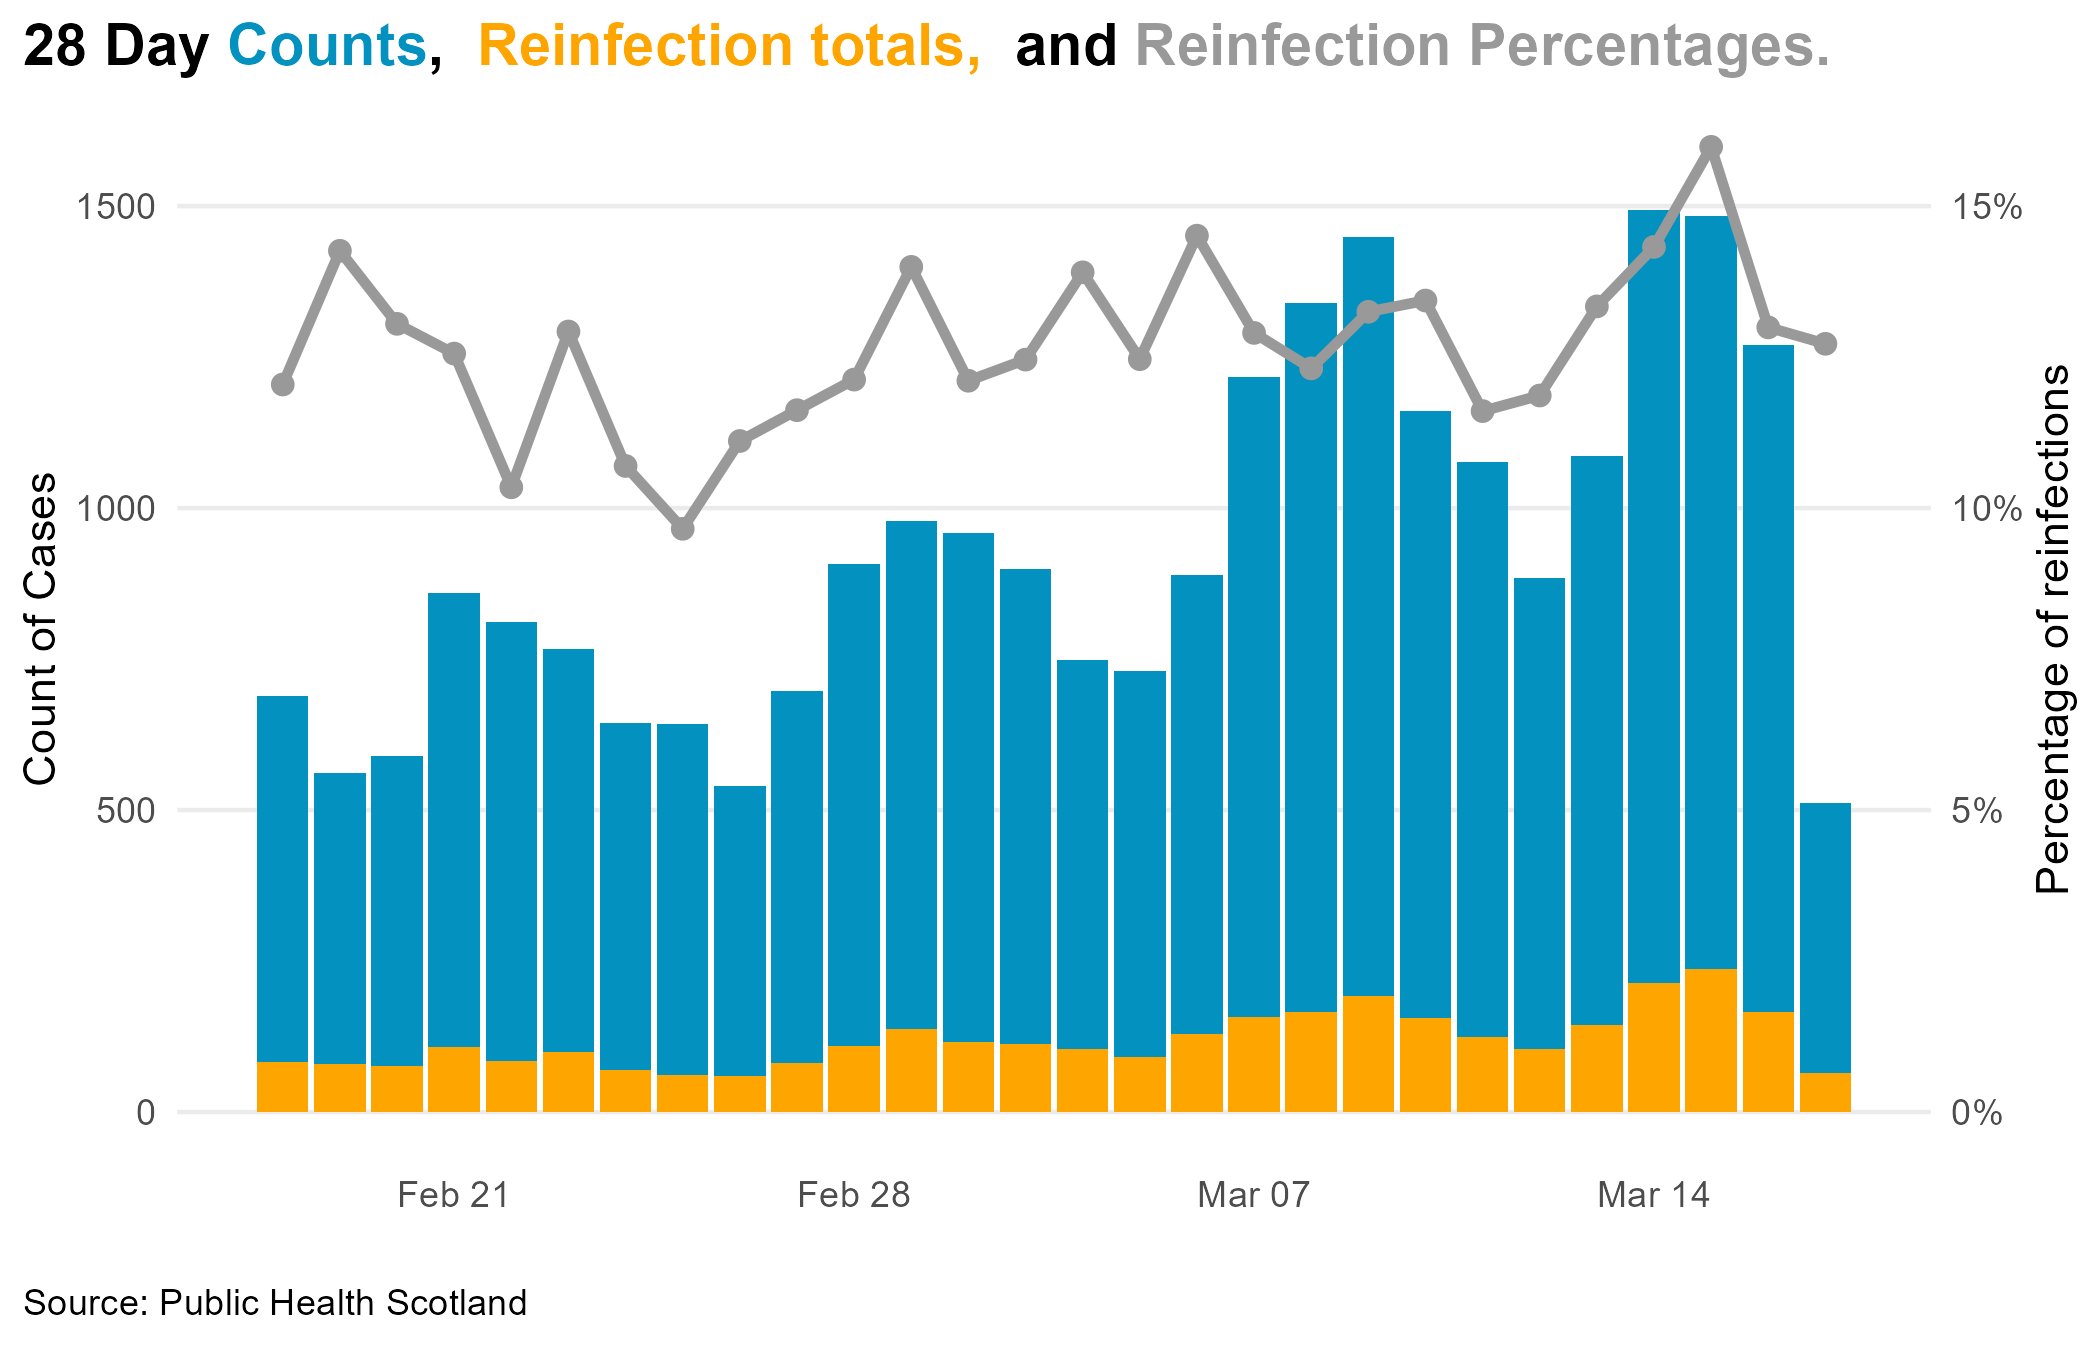
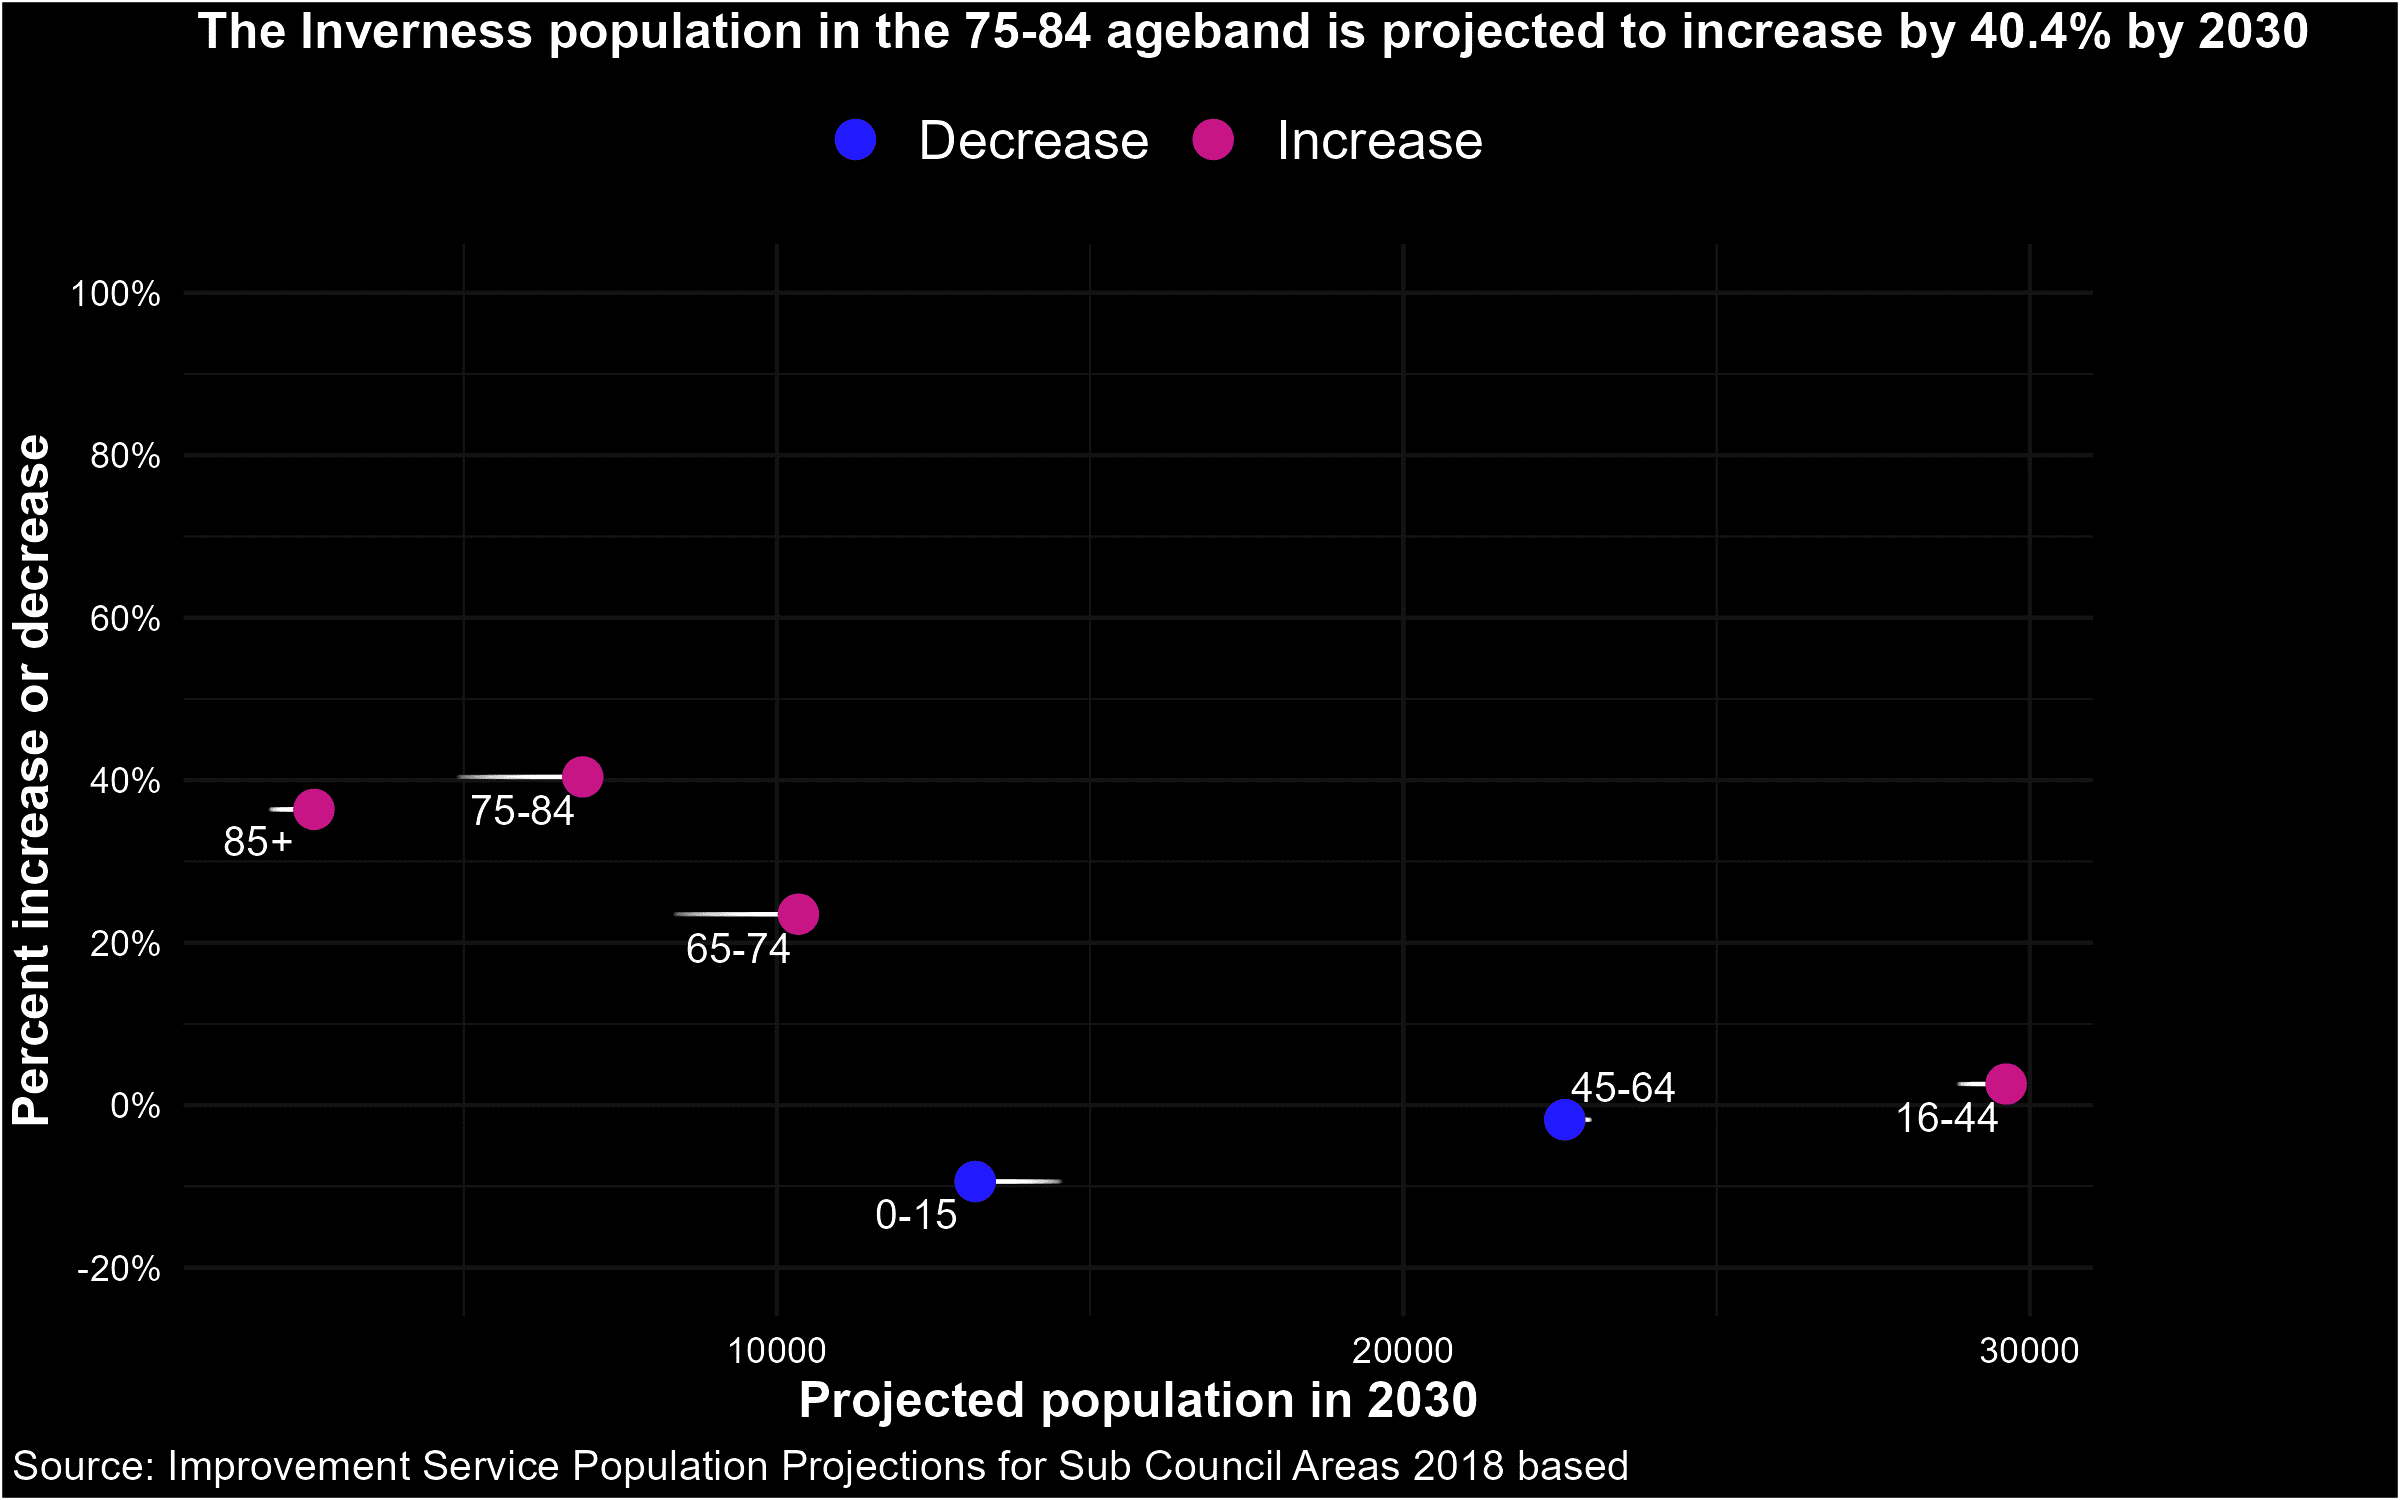
Dual axis charts in ggplot2 - why they can be useful and how to make them
Create Pareto charts in ggplot2 with custom legends using manual scales and ggtext Continue reading Dual axis charts in ggplot2 - why they can be useful and how to make them

Separate SQL
Why you should consider keeping your SQL queries in a separate file. Continue reading Separate SQL
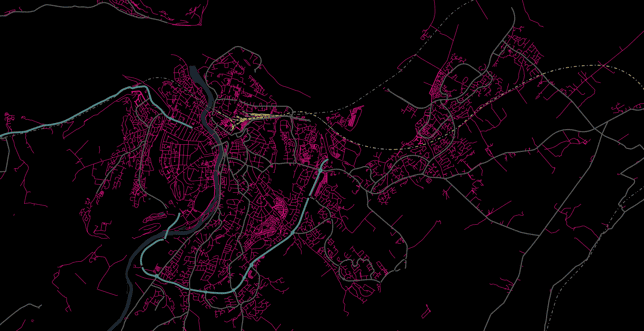
Inverness street maps
Ticking off the rstats bucket list - emulating Taras Kaduk’s street map - but in a Highland stylee with OSM, sf and ggdark Continue reading Inverness street maps
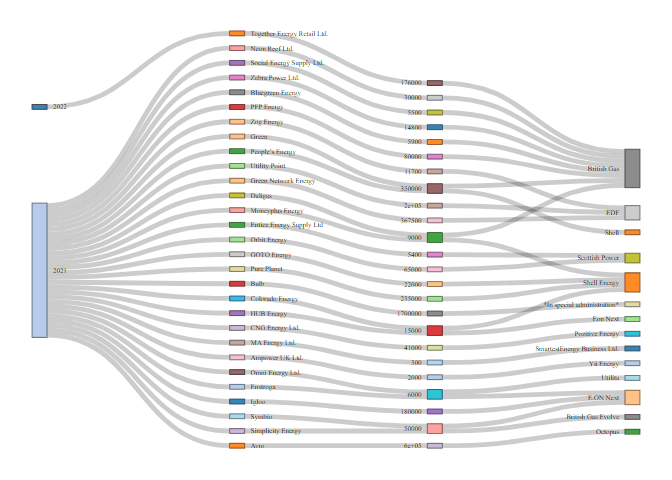
Visualising collapsed UK energy company acquisitions
Sankey plots are ideal to show the flow of customers from collapsing energy companies. Here’s how to prepare and plot your data with dplyr and networkD3 Continue reading Visualising collapsed UK energy company acquisitions
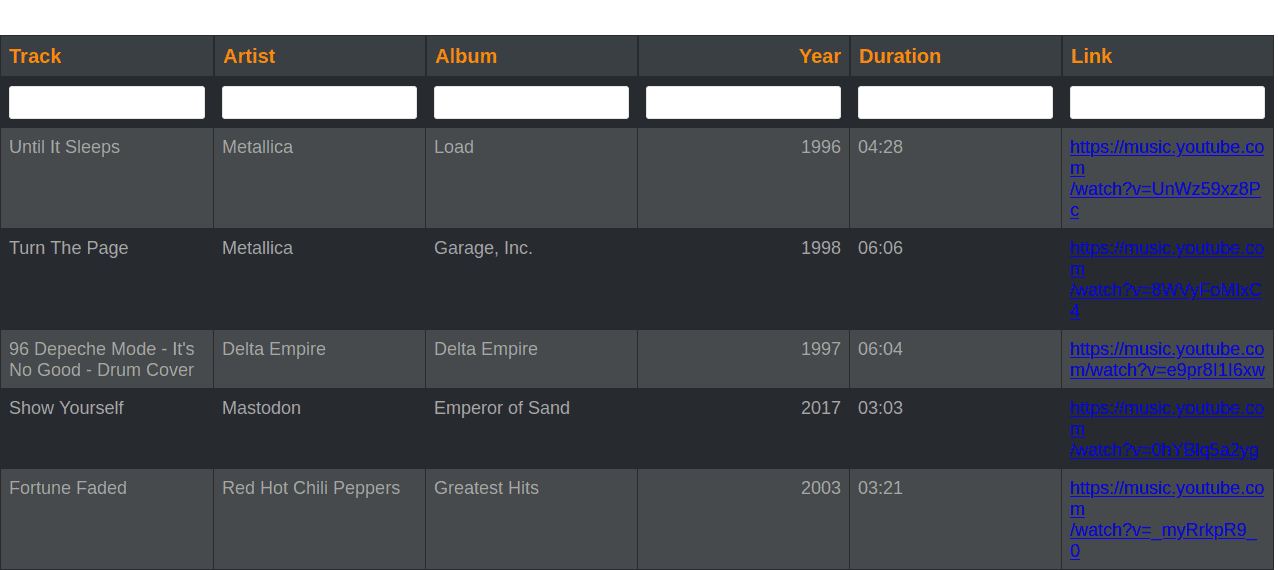
Reactable Rocks!
Make engaging tables in R with {reactable} and {reactablefmtr} Continue reading Reactable Rocks!
I got my first package onto CRAN, and YOU CAN TOO
Here are some tips and links to help you get your package onto CRAN Feel the fear, do the checks, go for it. . if I can do it, so can you Continue reading I got my first package onto CRAN, and YOU CAN TOO
cusumcharter available on CRAN
Introducing the cusumcharter package which makes it easier to create and plot CUSUM control charts. Continue reading cusumcharter available on CRAN
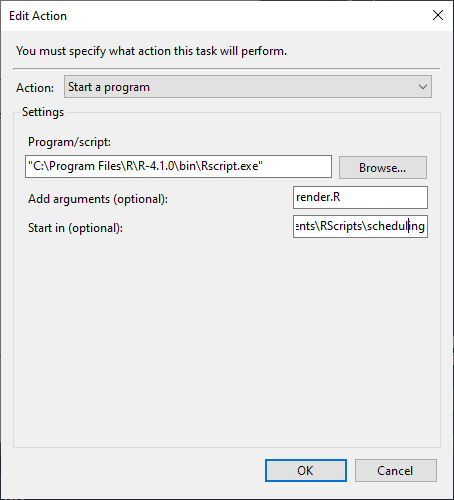
Scheduling Rmarkdown files on Windows - your foolproof guide
Scheduling an Rmarkdown or quarto script can be tricky - there are a few issues that are not always obvious. Here’s how to run yours successfully. Continue reading Scheduling Rmarkdown files on Windows - your foolproof guide
Passing parameters to SQL Server functions using R
Using interpolation to parameterise an input into the SQL Server DATEADD function, via R. Useful when you want to pass a variable somewhere deep inside your SQL query Continue reading Passing parameters to SQL Server functions using R
fwf without the faff
Fixed width files aren’t too common, but they don’t have to be scary. readr comes to the rescue with read_fwf() Continue reading fwf without the faff
Calculating hotel occupancy with R
Putting patientcounter to the test by calculating hotel occupancy. Continue reading Calculating hotel occupancy with R
Importing multiple Excel files
Ways to combine multiple excel workbooks into one dataframe, using purrr, data.table, rio and base R. Continue reading Importing multiple Excel files

Cutting down code in dplyr and data.table
Optimising code in data.table and tidyverse. Continue reading Cutting down code in dplyr and data.table

Introducing popthemes
Introducing another set of palettes and scales for ggplot2, based on pop album covers. Continue reading Introducing popthemes

Some data.table tips
Rolling joins, wrapping functions around regular DT[] calls, and more. Continue reading Some data.table tips
PreppinData - accepting the challenge with R and PowerBI
I’ve completed a month of ‘PreppinData’ challenges, using both R and PowerBI. Some things have been easy, some have not - here’s what I’ve learned in Week 1 Continue reading PreppinData - accepting the challenge with R and PowerBI

demystifying the coalesce function
coalesce is one of the most useful functions that you’re probably not using. Want to find the first non NA value from one or more vectors? You need coalesce Continue reading demystifying the coalesce function
collapse might rock your world
collapse is a new force in the data transformation stakes. In this post, I try out one simple function and compare it to data.table and dplyr Continue reading collapse might rock your world

NHS-R Community Conference 2020
The 3rd Annual NHS-R Community Conference went virtual, and was an amazing success Continue reading NHS-R Community Conference 2020
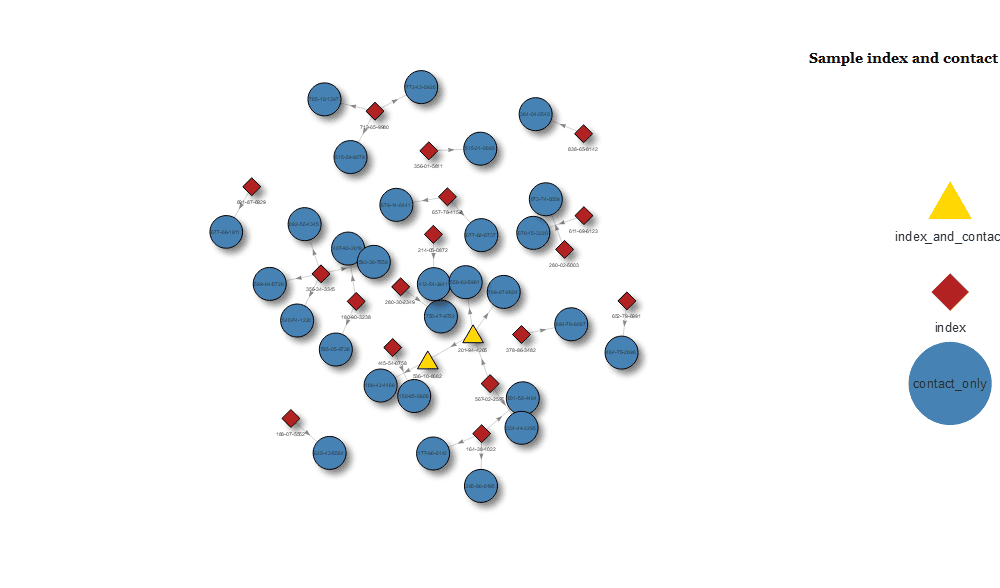
Getting started with network plots
The visNetwork package greatly simplifies the process of producing useful, interactive network plots. Continue reading Getting started with network plots

metallicaRt
Seek and Destroy meets School of Rock as a new Metallica inspired colour pallete package for R Continue reading metallicaRt
QI at R/Medicine 2020
Rapid Analysis and Presentation of Quality Improvement Data with R Continue reading QI at R/Medicine 2020

Solving small data problems with data.table
Combining elements from different rows while discarding NA values Continue reading Solving small data problems with data.table
SIMD Revisited
Visualising the 2020 Scottish Index of Multiple Deprivation data. Continue reading SIMD Revisited
patientcounter
Introducing the patientcounter package to create census tables without crashing Excel, and no need for SQL Continue reading patientcounter

Programming with data.table
getting started with multiple bare variable names in data.table functions. Continue reading Programming with data.table
data.table from scratch - a dummies guide
An introduction to data.table from scratch for beginners or new users. Continue reading data.table from scratch - a dummies guide
gganimation for the nation
gganimate is now on CRAN so taking it for a test drive Continue reading gganimation for the nation
Where am I?
Notes on the here package Continue reading Where am I?
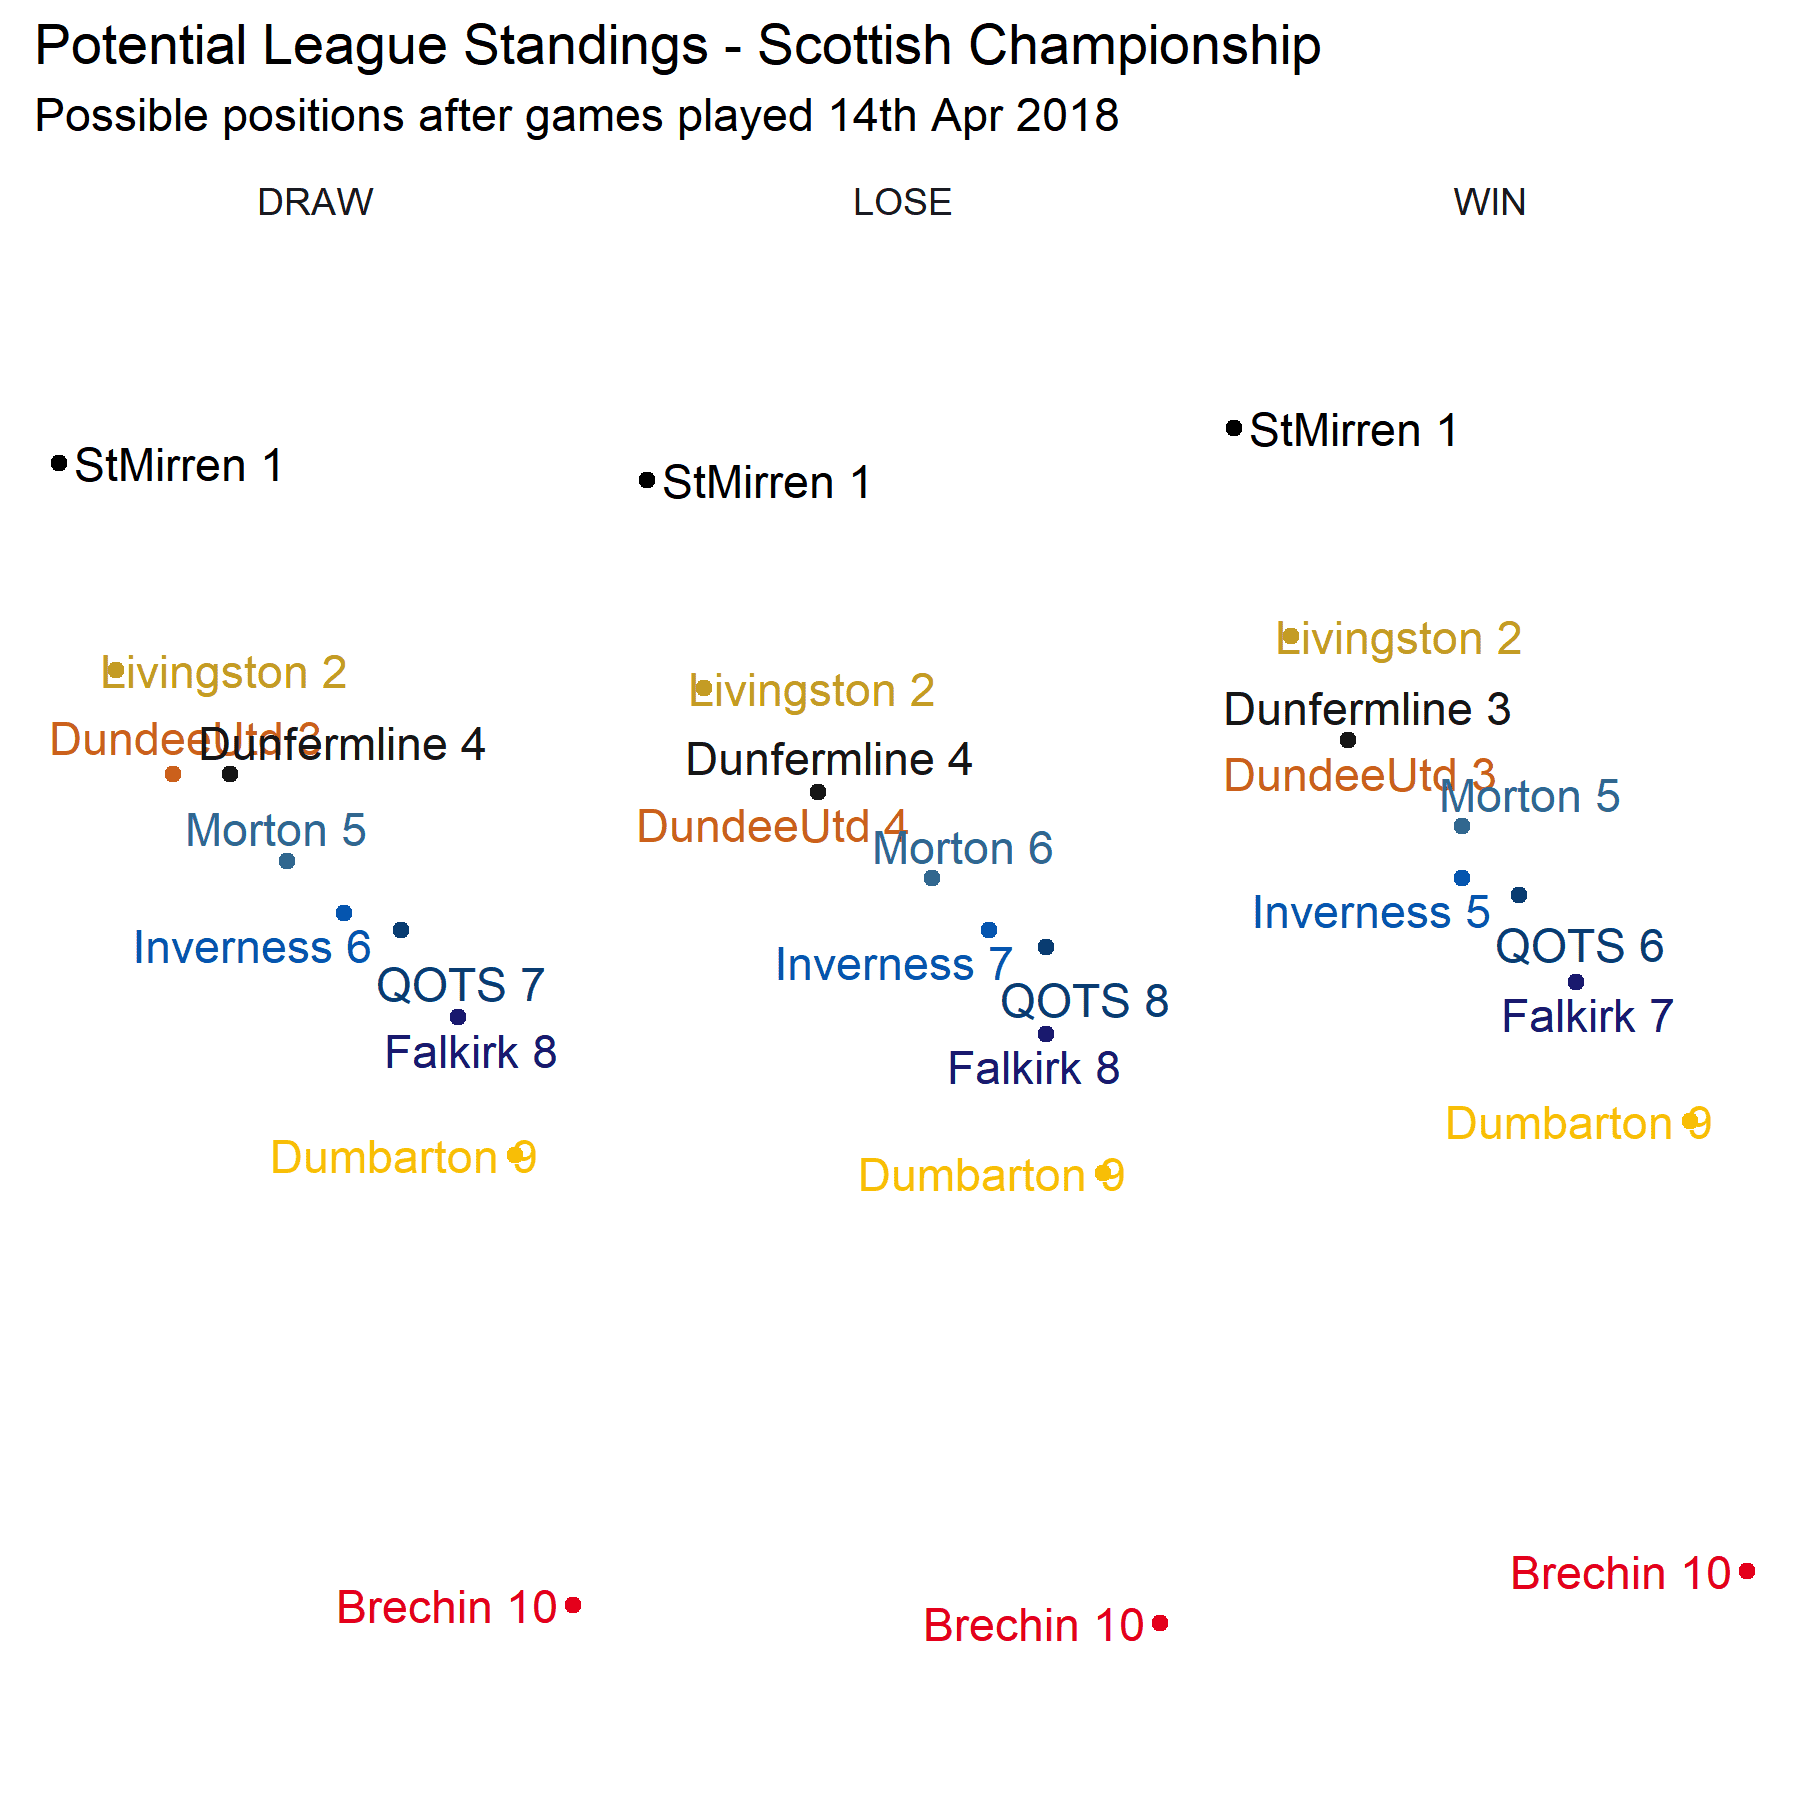
Mid Table Mediocrity
Visualising potential winners and promotion prospects in the Scottish Championship Continue reading Mid Table Mediocrity
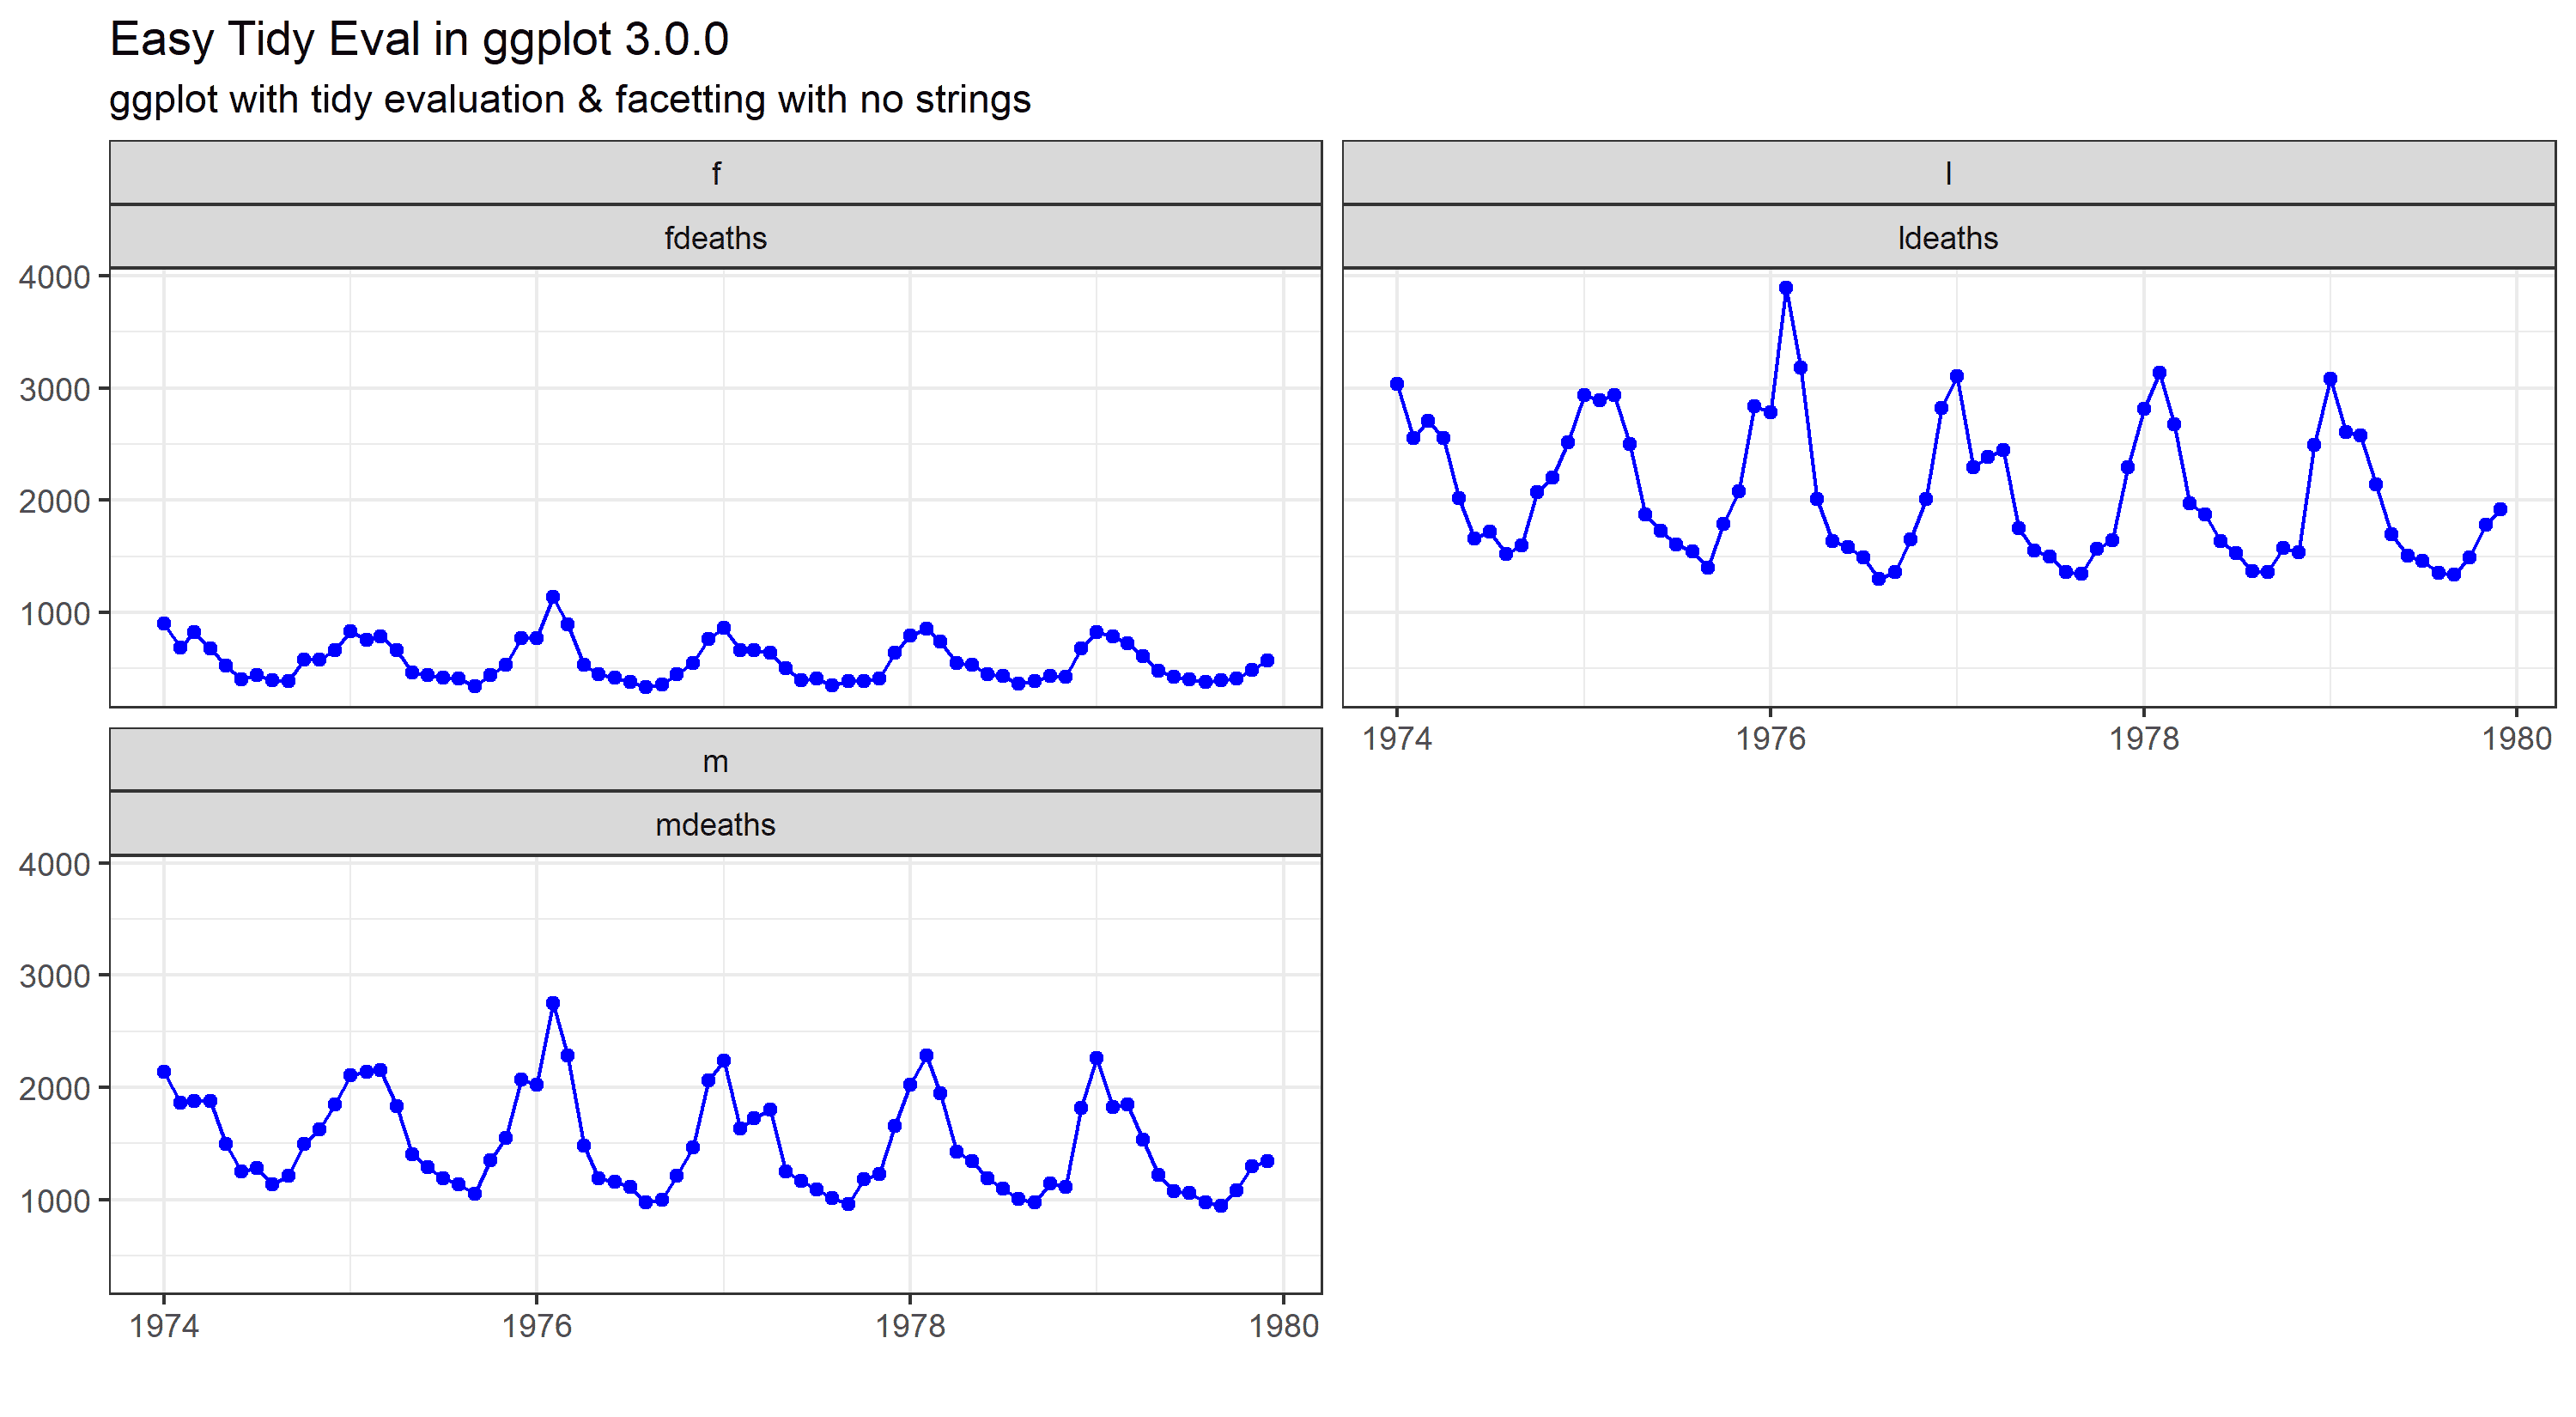
More tidy evaluation with ggplot2
Another look at tidy evaluation with a slight twist on the previous post Continue reading More tidy evaluation with ggplot2
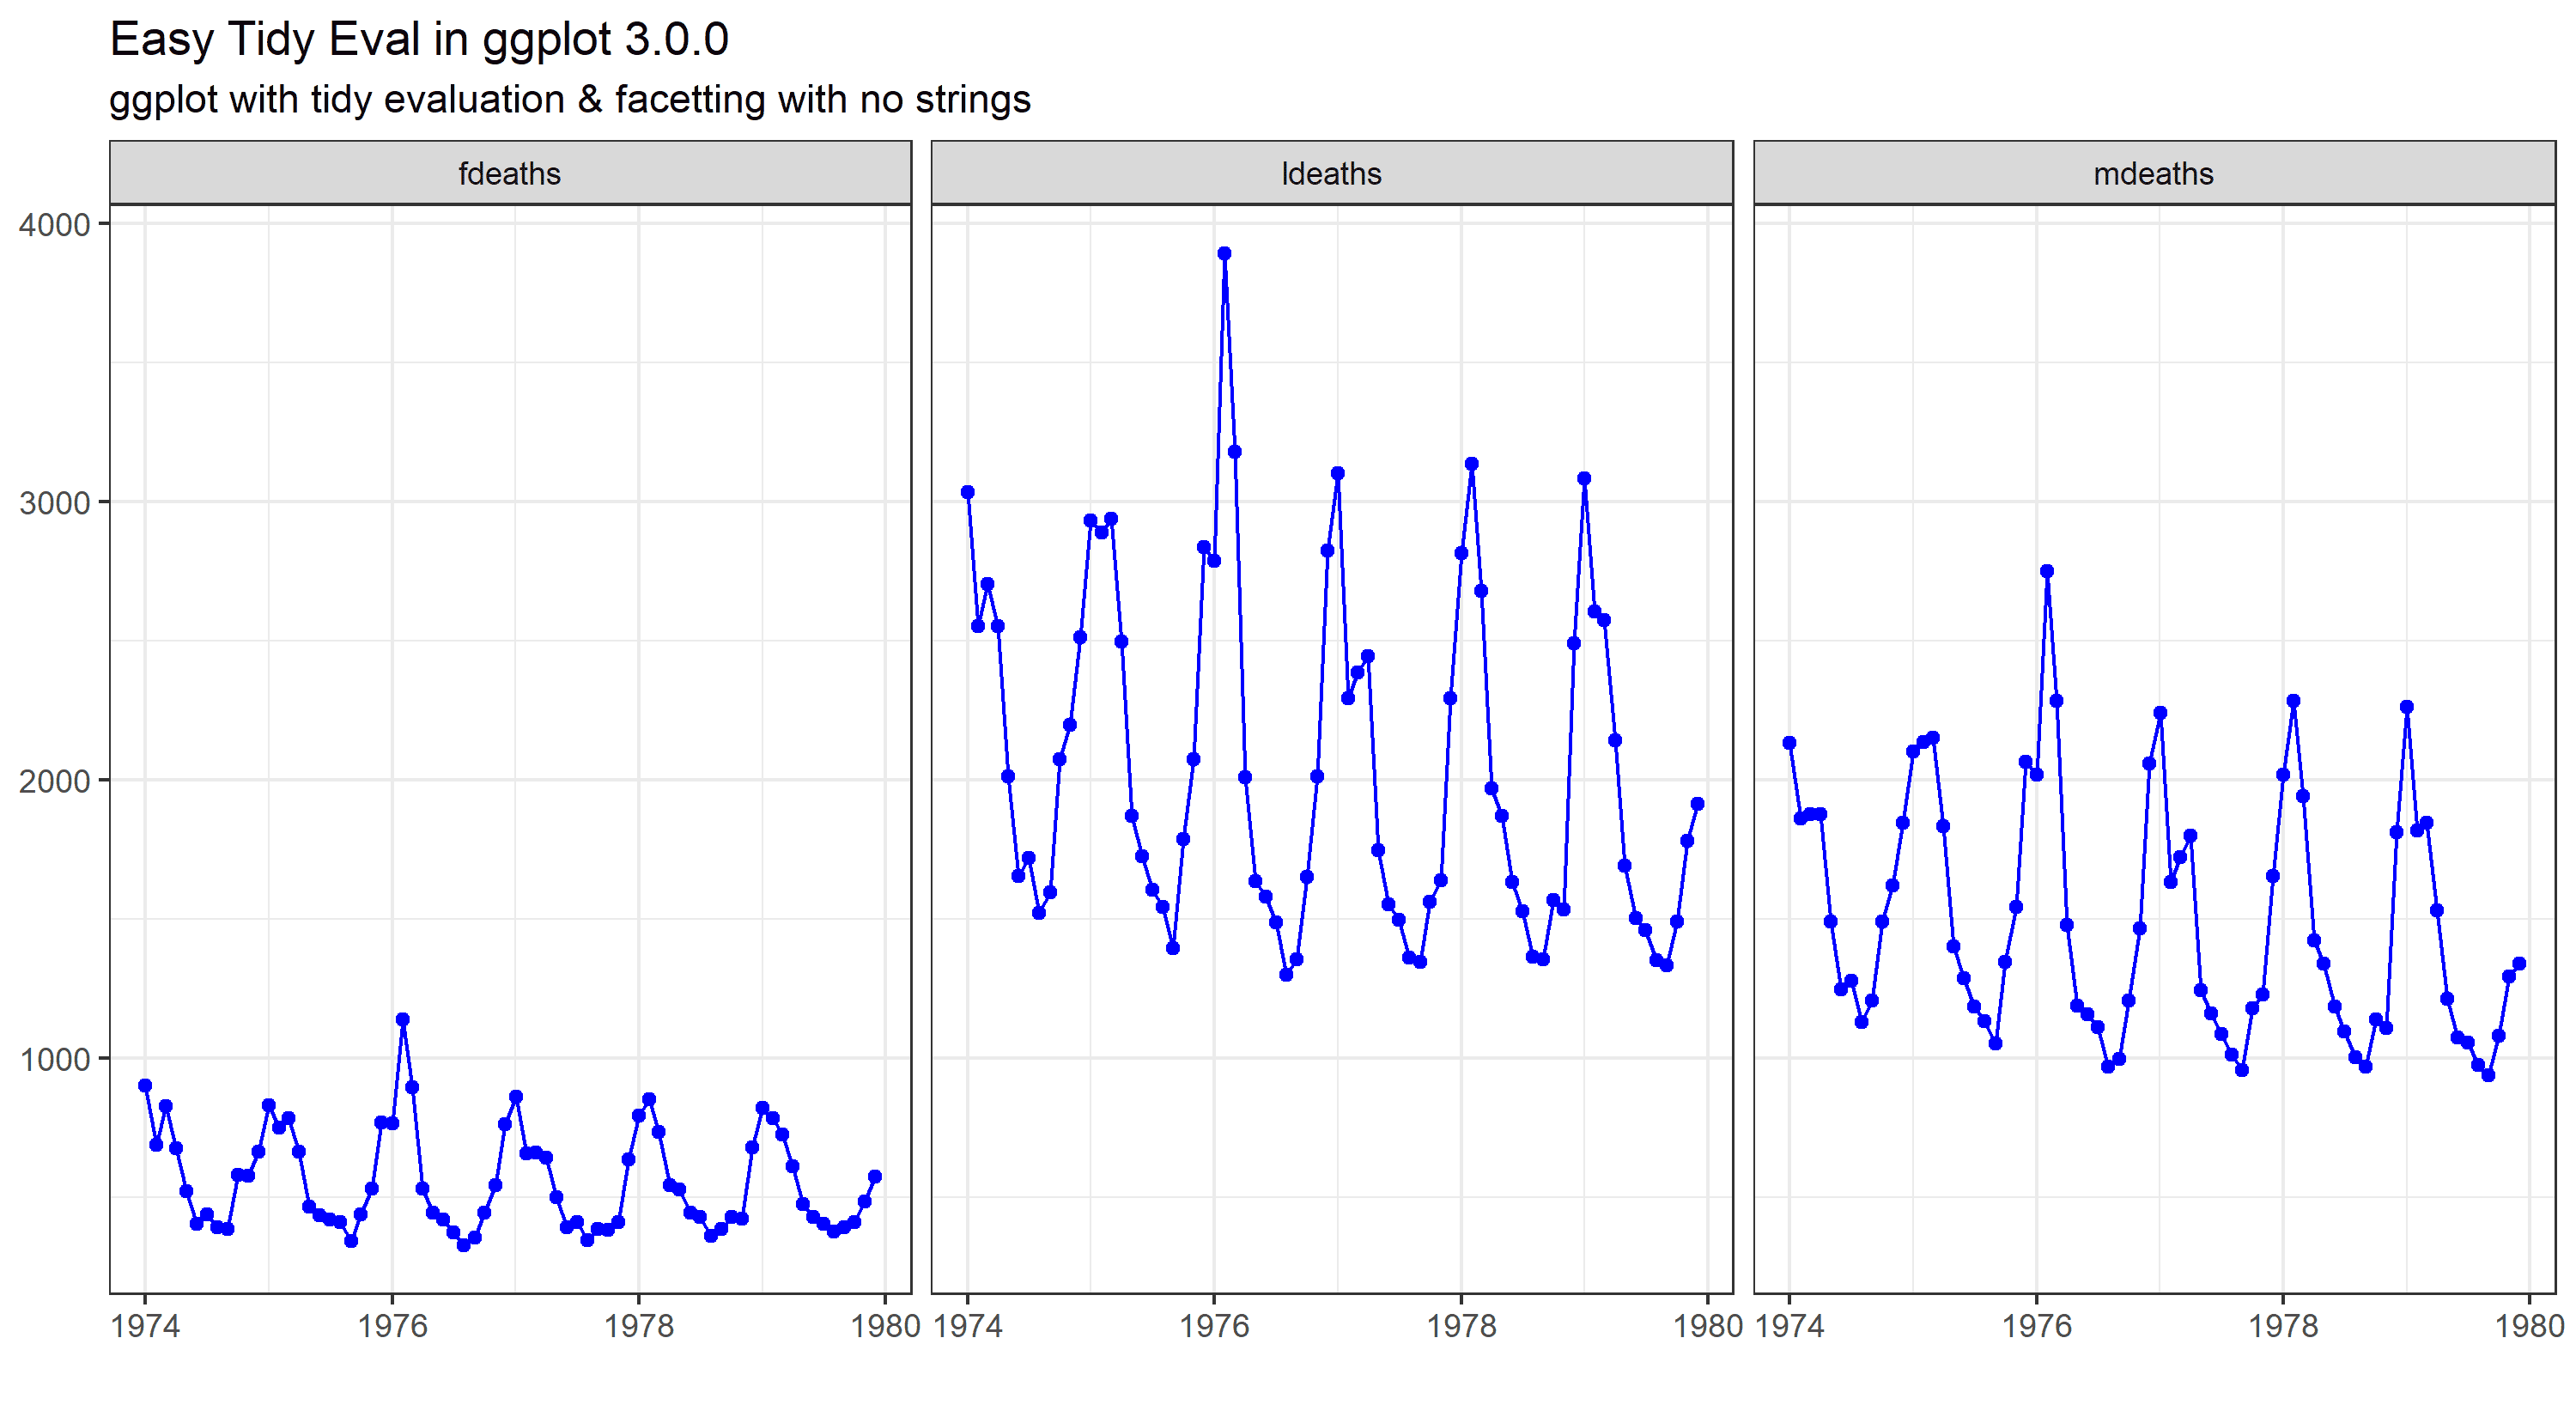
Tidily evaluated ggplot2
Test driving tidy evaluation in the new release of ggplot2 Continue reading Tidily evaluated ggplot2
Even Simpler SQL
A follow up post, with improved SQL and dplyr code Continue reading Even Simpler SQL
simpler SQL with dplyr
comparing dplyr with SQL nested queries - and there is only one winner Continue reading simpler SQL with dplyr

AphA Scotland - it's a thing now
Reflections on AphA Scotland launch event Continue reading AphA Scotland - it's a thing now
Simply Mapping
Using the simple features package (sf) to map Scottish Index of Multiple Deprivation (SIMD) 2016 data Continue reading Simply Mapping
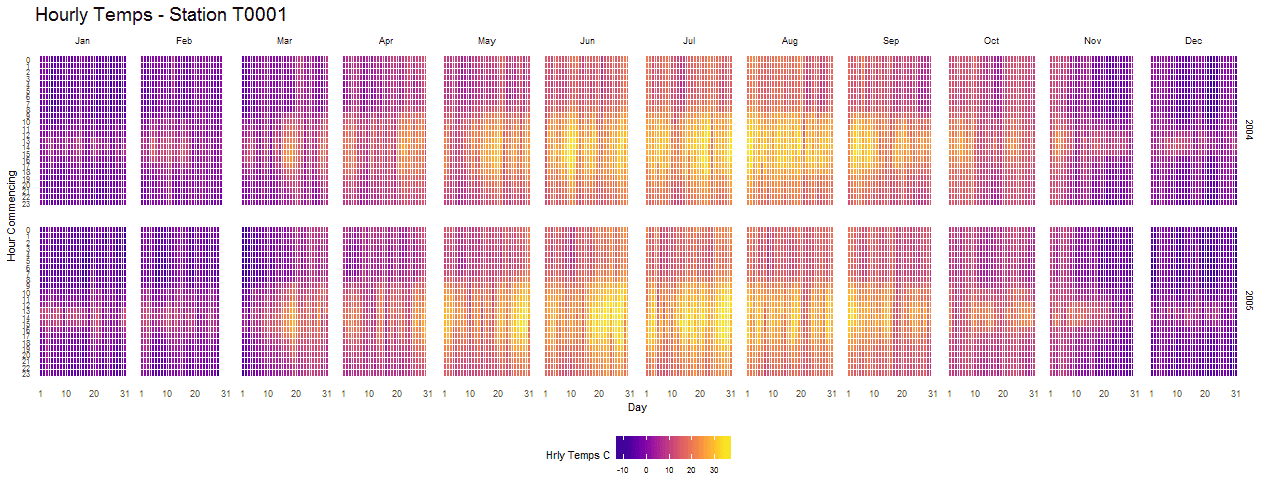
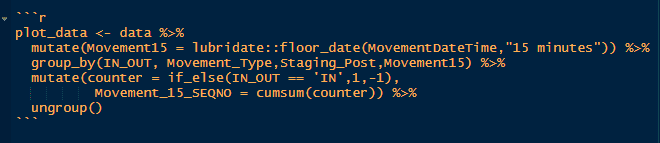
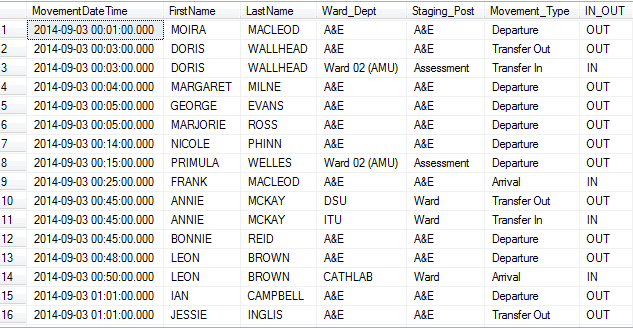
The hourly heatmap with ggplot2
A 24/7 timeseries heatmap with ggplot2, dplyr and lubridate Continue reading The hourly heatmap with ggplot2
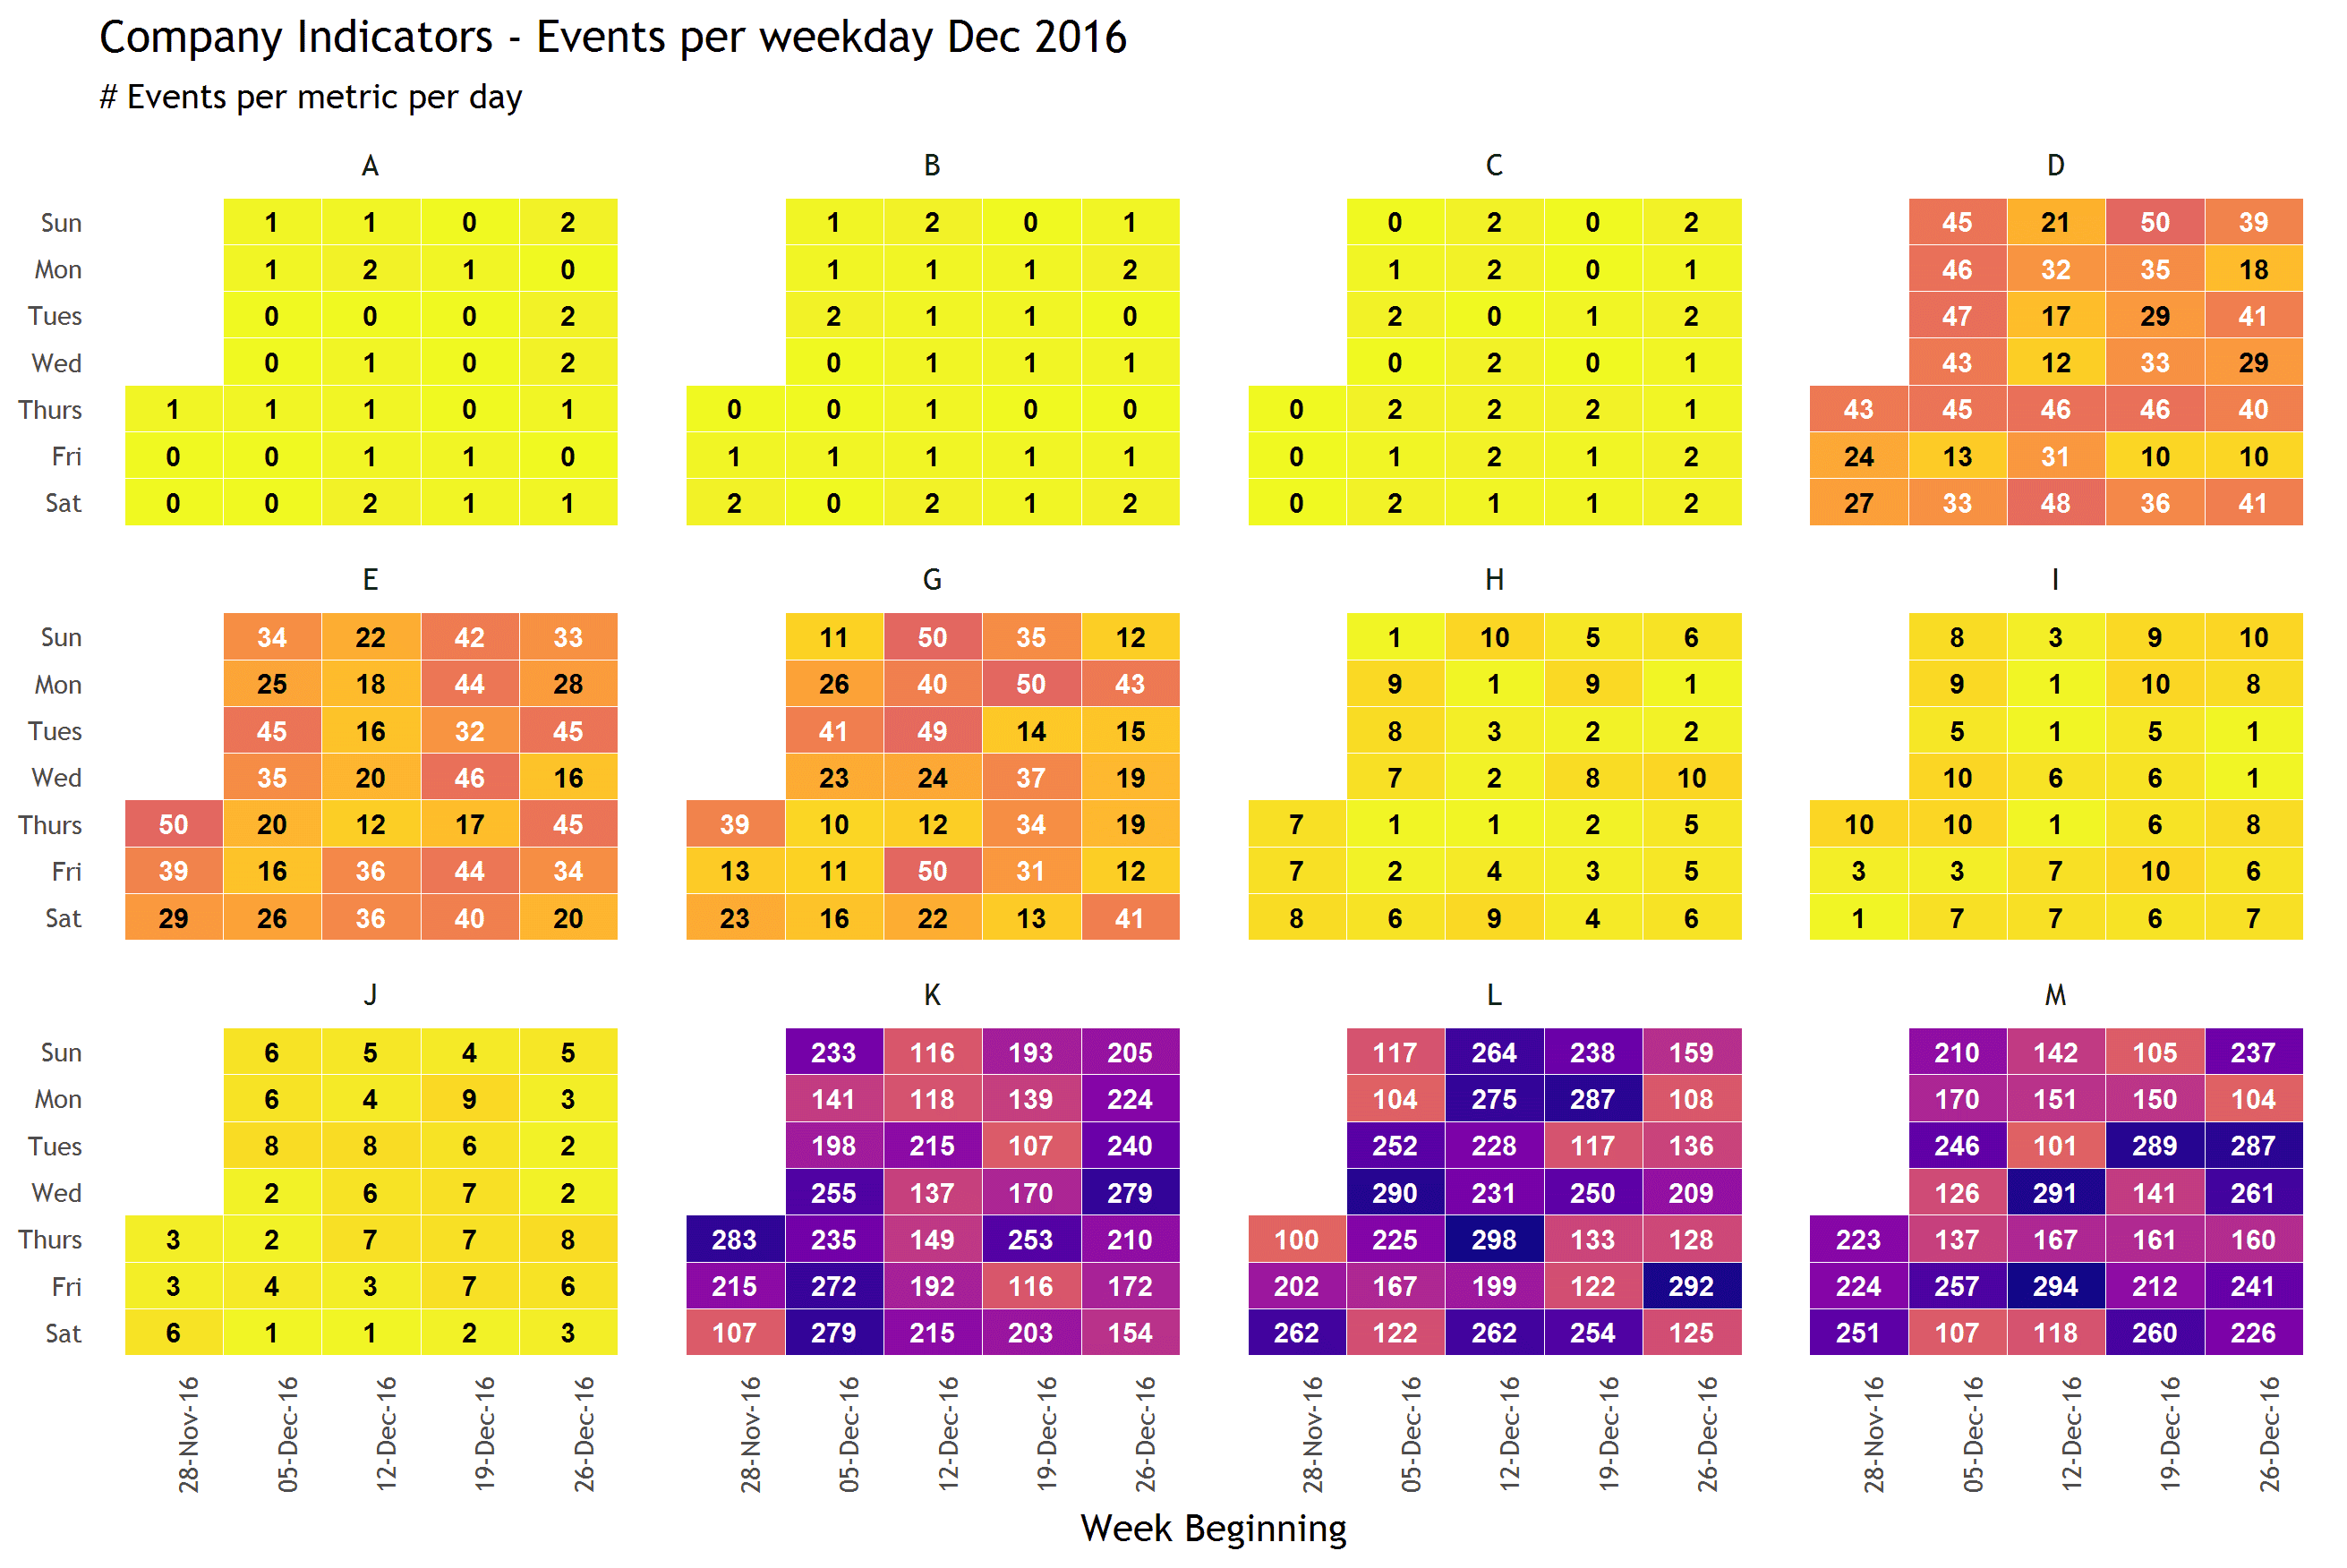
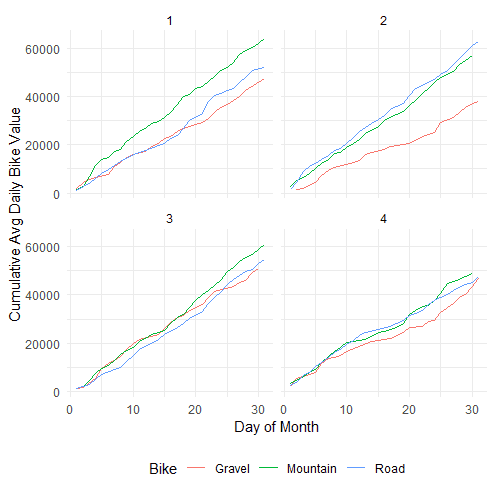
Daily metric tracking with ggplot2
Create calendar style plots over the same period with ggplot2 Continue reading Daily metric tracking with ggplot2
F is for Forecast
First steps with understanding time series, the forecast package and prediction using R Continue reading F is for Forecast
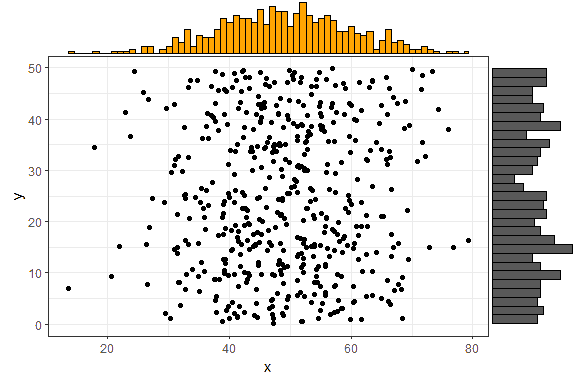
ggExtra is Extra useful
Amending scales on ggplots with easy to remember syntax Continue reading ggExtra is Extra useful