
To 'P' or not to 'P'?
Which SPC chart is best? A perennial favourite, where we can all be right and wrong at the same time.
Every time I think I'm done thinking about Statistical Process Control charts, I get dragged back in again. This week it was my long time associate and "Red Green and Grey dots" (note to self, add link to old blog post here1) collaborator Neil Pettinger, who asked this question on the wonderful site that is LinkedIn.
For the sake of avoiding too much time on there, Neil asked which was the correct choice of chart - the X chart (or Individuals chart, or XMR - why has this chart got so many names?), with wider control limits, or the p-chart, with flexible limits, with many points both above and below the control limits.
This is the chart in question (reproduced with Neil's permission):
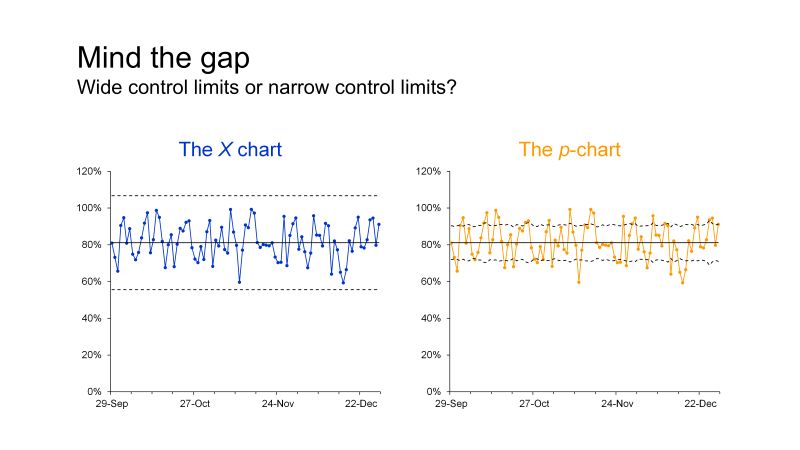
Now - with the caveat that I am free-styling this late at night, let's delve into it:
First, we don't actually know what this data represents. The y-axis labels on both charts are formatted as percentages, but we don't know "percent of what?". The left hand side is the X chart, and the right hand is one of my favourites, and certainly most-used, the p-chart.
Normally, when plotting a p-chart, you are plotting proportions, usually the proportion that did not do the "thing" in question. In other words, you are in a situation where there are only two possible outcomes, a binary pass/fail scenario. The percent breaching a target. The percent failing an exam. The percent of cars failing their MOT (don't ask). You generally look at the proportion of failures, not the successes.
So, if this chart was plotting ED attendances, as in the context of being seen within the target time, then it should really be plotting the proportion that breached, rather than the proportion that passed. As it turns out, the underlying mechanics are the same, but, you can find yourself having some very narrow limits when plotting successes rather than failures, or at least, that has been my experience. With very narrow limits there is little to be learned. Another source of narrow limits is when you have very large denominators, in which case you need a p prime or Laney p-chart, which accounts for the overdispersion and resulting narrower limits. For example, I might get away with a regular p-chart plotting mortality for a relatively small hospital, but I'd definitely need a Laney corrected chart if I was plotting data for the whole of Scotland.
Anyway, slightly jumping the gun a bit here. Neil asked the question, and then I imagine he did something like this, because asking an audience involving NHS analysts anything about SPC is a sure fire way to get some interaction.

I was one of the first to dive in, discounting the x chart, "for several reasons" and then proceeded to give the worst possible reason. "Because the upper control limits are over 100%". Why did I choose that one? (Every time I post on LinkedIn I make myself look a bigger idiot than before). How about the fact that the limits are too wide in general, or that the X chart is less sensitive to special cause variation than other SPC charts, and that it often assumes that the data cannot be broken down into smaller, more appropriate sub groups. This is an important point. I sided with the p-chart, but stated that it was likely that given the amount of signals, the underlying data should be investigated and organised into futher sub groups. Such as? Well, if this is ED data (and we don't know), then it could be broken down into 4 sub groups (Majors, Minors, and the 2 others I can't remember off-hand). Given the plethora of ED data, I would want it broken down by day of week as I expect there to be a different arrival profile on a Saturday than a Wednesday, for example.
Another rational way of looking at it would be by hour of day. That would be 24 control charts. No one's going to look at those are they? Well I would. And by day of week. That's why I worked on {spccharter}2 and produced the 24/7 heatmap3 to help make looking at this stuff at this level of detail a whole lot easier.
Anyway, some other folk agreed that the p-chart might be a good choice. Some other people didn't and preferred the X chart ( or "I chart", whatever. I rarely use this one, I genuinely can't think of many scenarios where I'm being asked to analyse a continuous variable, whereas counts, rates and percentages occur all the time.)
They wondered if the data was from a binomial distribution, as if not, the p-chart shouldn't be used. Whenever I've seen a guide to choosing the "correct" chart - I don't recall seeing anything about the theoretical underlying statistical distribution of the data. Of course, you need to understand the data - which again, would lead me to stratify it different ways, but the distinction is "are the data binomial?". As in pass/fail. Only 2 possible outcomes. The calculations for the limits of these charts follow the theory of various statistical distributions but I haven't seen anything that says the data itself must conform to those distributions. There is a difference.
Someone suggested plotting both as the way forward. Why not? If you can plot one, you can plot both. Hopefully you see the same sort of signals on both, but again, with the X chart you may not.
Look at both charts - regardless of which one is correct, the process average is coming in around 81 or 82 percent. Now, if this was ED attendance data, with a 95% target, I would have several questions, but "what statistical distribution is the data from?" wouldn't be the first one on the list. I'd be investigating it, breaking it down, and probably realising that there were several sub-systems, some well performing and other doing very badly. That's the conversation starter - what is going on with this group that is doing very badly? What are the challenges there? Followed by digging into the bad hours and days and trying to understand the recurring events that are impacting performance. That would almost certainly require talking to someone else who actually knows what's going on.
We can pretty much all plot these charts now, but just as "you can't fatten a cow by weighing it", you can't magically improve performance by charting it. At some point, someone with actual domain knowledge needs to be brought into the loop. Or even better, maybe they approach you in the first place.
Anyway, getting back to X charts, their assumptions, and statistical distributions. X charts are useful when the data cannot be split into subgroups. I don't know for definite that is the case here, (but I doubt it, given the volatility). They do provide wider limits and are less sensitive than other specialist charts. I personally wouldn't want a less sensitive chart, so I would discount the X chart again. My (almost, but not quite) pristine second edition of the Health Care Data Guide tells me there is little need to be concerned about any specific statistical distribution with Shewhart (SPC) charts (my italics). And I was very glad to read that, because I've never given it much thought. Mainly because I'm always working through the following thought process4 - is this a count? It's a c-chart. Can it have more than one failure type (like my car at the MOT)? Then it's a u chart expressed as a rate. Is it a binary pass or fail? It's a p-chart. And that's it, the binomial distribution doesn't come into my thinking because the binomial part is the pass/fail element.
How do I wrap this up? I'm not convinced by the arguments in favour of the X chart. We're plotting proportions of something, so its discrete data, not continuous. We don't know that the data can't be stratified, or broken down into sub-groups, but I suspect that it can be because of the volatility. That is nearly always a sign of multiple processes combined. We know the X charts are "good enough" but they can produce wider limits. We know they can be less sensitive.
We don't know what we're plotting but if it was something really important (and if it's not, why are we bothering?) - are you genuinely going to go with a less sensitive chart?

I'm all for "good enough" if time is short, but for established reporting, I'd prefer to use the correct chart for the job. In the absence of any further enlightening information, I'm sticking with my plan to investigate further, stratify, plot as small multiple p-charts, possibly even Laney p-charts if the denominators are still large and then seeing what comes out of those plots. That would almost certainly mean getting in touch with someone more closely involved to discuss what I've found, and work out the next steps.
So, I will very much "have a p please Bob"5 in this instance.
1 We all knew I was going to forget to do this. It's here
4 Sometimes I do have them
5 Some will get the reference, some won't. The ones that do will likely keep quiet, so as not to out themselves as being depressingly old.